자동차이야기2015. 4. 14. 05:58
악의적으로 모아놓을 것일수도 있겠지만, 참 조사많이 했네요. 이렇게 data를 가지고 까는것은 현대차측에서 data로 응수해야할텐데, 현대가 별다른 답변을 안했겠죠? 별다른 답변은 인터넷에 못찾겠네요.

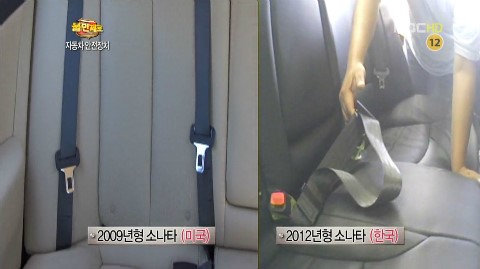
두번째 링크에서 2012년 국내 소나타 뒷자석 안전밸트가 2점식이라는 얘기가 있습니다. 사실이 아니라고 믿고싶네요. 정말 그렇다면 생명과 몇천원을 바꾸는 격인데.

내수는 그렇게 하고 수출형은 그렇게 안하고, 분노가 빡치긴 하네요.
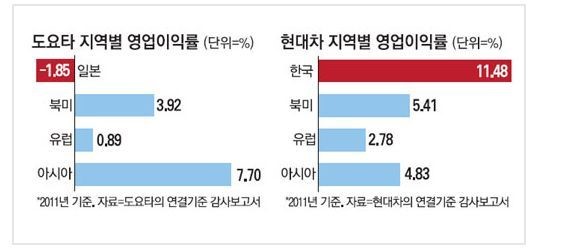
현대자동차의 지역별 영업이익률에 대해서 말이 많았는데, 한국에서 수출하는 차도 많고 더이상 데이타도 공개하지 않으니 정확한 상황을 알수 없으니, 일본 도요타 자국내 영업이익률은 정말 부럽군요. 일본은 우리보다 더 골수 '국산'만 고집하는 사람도 많고 세계 최고의 자동차는 더더욱 그러할텐데, 도요타 일본 영업 이익률이 -1.85라니, 믿기 어려운 수치네요.

작년말에 작성된 두 글이네요. 작성시간 2014-11-01 14:37:07


사고났을때 안전을 책임지는 안전벨트


소나타 안전벨트의경우 기존3점식 안전벨트를 버리고 
원가절감을위해 버스에나 사용되는 2점식 안전벨트를 체택 
고맙습니다. 참.. 


밑에표는 일본의 도요타자동차의 지역별 영업이익율과 비교한것이다.
한국은 호갱이 맞는듯 싶다.


엔하위키에서 현대자동차 비판 위키가 있네요.

https://mirror.enha.kr/wiki/%ED%98%84%EB%8C%80%EC%9E%90%EB%8F%99%EC%B0%A8/%EB%B9%84%ED%8C%90


내수 수출 차별은 오해라는 글도 있고요.

http://www.autodiary.kr/%EB%82%B4%EC%88%98%EC%B0%A8-%EC%B2%A0%ED%8C%90-%EC%B0%A8%EB%B3%84%EC%9D%80-%EC%98%A4%ED%95%B4-%EC%86%8C%ED%86%B5%EC%97%90-%EB%82%98%EC%84%A0-%ED%98%84%EB%8C%80%EC%B0%A8/

Posted by 쁘레드
자동차이야기2015. 3. 25. 01:59

도요타는 20세기에 최고 기술력 정점을 찍고 그 뒤로부터 quality engineering과 marketing에 너무 집중한 case인것 같다. 2000년대초 차들은 정말 잘 만들었는데, LEXUS도 초기에 좋았고. Qulity engineering도 기술이라면 기술력이 너무 좋은듯. 미국 회사들이 망한 이유중에 하나지요. 기술력이 너무 좋아서.

----------------------------------

Toyota Engine Excessive Oil Consumption

Owners Are Burning Through 1 Quart of Oil Every 1,200 Miles


An increasing number of Toyotas are experiencing excessive oil consumption which may be the result of defective piston rings. Toyota, in all their deny-til-we-die splendor, is reportedly denying warranty coverage on many oil consumption related problems and telling owners that burning through oil is normal.

Burning the midnight oil in college? That's normal. Burning through a quart of oil in 1,200 miles? Not so much, at least in our book.

Share on Facebook Retweet this page

The Cause of All the Oil Burning

Even the most judicious oil-changers are reporting issues that probably shouldn't happen. Things like:

  • Having your "oil pressure" light come on halfway through your maintance schedule.
  • Having you engine burn through as much as 1 quart of oil in 1,200 miles
  • Being told that your engine burning through oil is "normal" and "nothing to be alarmed of"
  • Having to come back with a damaged, oil-deprived engine only to be denied warranty coverage

Guess which of these is happening to Toyota owners? Go on, I'll give you a minute. (Hint: this is a multi-choice test)

If you guessed all of them, you're absolutely right.

Toyota Issues a TSB

On August 11, 2011, Toyota issued a technical service bulletin (TSB)[1] to dealerships which says:

"Some 2006 – 2011 model year vehicles equipped with the 2AZ-FE engine may exhibit engine oil consumption. The piston assembly has been changed to minimize oil consumption." And that "P030# (cylinder # misfire detected) DTC may also be set as a result of oil consumption."

Unlike a recall, a TSB is basically a set of instructions given to dealership mechanics on repair procedures and warranty information. In this case Toyota says repairs should be covered under the standard Toyota Powertrain Warranty (60 months / 60k miles), but only after a test. The dealer is told to confirm the engine's oil level, mark the dipstick and then advise the customer to drive for 1,200 miles before returning for an inspection. At that time, only engines that are more than 1 quart low will have their warranties honored.

So what about those that are outside the standard powertrain warranty or fail the test? They're left to pickup the bill which can be thousands of dollars. Take it from these folks on CarComplaints.com:

"So after loving my Toyota for many happy years imagine my heartache when it began using oil to the tune of visible loss on dipstick at <100 miles. Having always prided myself on taking car maintenance very seriously and never owning a vehicle less than a decade this one is a total disappointment" -scaredgrammy in Dry Ridge, KY

"At some point around 100,000 miles I was shocked to find little or no oil on the dip stick so I started watching it closely. The car no has 149,000 miles on it and burns a bit more then 1 quart every 1200 miles. This just happens to be the amount that Toyota calls a problem and excessive, BUT our car is out of warranty. Amazing two weeks ago I ask the Toyota service manager about it and he said he never has heard of this … That is a totally false statement since there is a TS bulletin about this problem! Toyota's engineers made an error with the design of the pistons." -pstef in Newton Falls, OH

Affected Vehicles

Take a moment to browse through the Toyota section of CarComplaints.com and you'll see just how many people have reported problems with the oil consumption in their engines, including Camry, Corolla, Matrix, RAV4 and Solara owners. This problem also extends to some Scion vehicles, which is one of Toyota's brands.
Posted by 쁘레드
자동차이야기2015. 3. 18. 05:45

동네에서 멀지 않은 toyota 매장 website에 들어갔더니. 엄청나게 싼 리스(lease) deal들이 대문앞에 쫙 있습니다. 샌디에고는 대도시는 아니라 최저가격이 아니니 LA쪽에서 알아보면 더 좋은 딜들이 많을것 같습니다.


미국에서 가장 많이 팔리는 자동차중 하나인 camry가 그것도 LE가 아닌 SE가 $99 + 3999(down)인것은 처음보네요. 3년 총 비용이 $7600으로 제 기준으로 비싸지만(!) lease관념으로 상당히 저렴합니다. 한달에 $211 정도니까요.


엔저를 무기로 일본자동차의 파상공세와 떨어진 유로화를 등에업은 유럽자동차들의 공습까지... 재밌는 시장입니다.

다음에는 현대 광고를 찾아서 올려드리죠. 소나타(sonata)도 새로운 모델이 나오자마다 상당히 공격적으로 가격을 많이 낮쳤는데 지금은 더 낮쳐야 할것 같음.


'자동차이야기' 카테고리의 다른 글

Toyota Engine Excessive Oil Consumption  (0) 2015.03.25
미국 현대자동차 공격적 가격  (0) 2015.03.20
한국 luxury car sales  (0) 2015.03.14
2015.03 (March) US Auto Sales  (0) 2015.03.08
애플카에 대한 생각, Apple Car  (0) 2015.03.04
Posted by 쁘레드
자동차이야기2015. 3. 8. 07:04

미국 2015년 2월 자동차 판매량

SUV And Crossover Sales Rankings

Click Column Headers To Sort • January 2015 • February 2014

RankSUV/CrossoverFebruary 2015 YTDFebruary 2014 YTD%
Change
February
2015
February
2014
% Change
#1Honda CR-V45,50938,99116.7%22,29820,7597.4%
#2Toyota RAV441,76733,33125.3%21,94316,45133.4%
#3Chevrolet Equinox41,27836,13414.2%21,72321,5870.6%
#4Ford Escape40,96942,604-3.8%20,91523,145-9.6%
#5Nissan Rogue37,06831,02819.5%21,41917,19724.6%
#6Ford Explorer35,64926,73433.3%18,61313,92433.7%

Passenger Car Sales

Click Column Headers To Sort • January 2015 • February 2014

RankCarFebruary 2015February 2014%
Change
February
2015
February
2014
% Change
#1Toyota Camry59,70552,33014.1%32,94228,99813.6%
#2Toyota Corolla55,19648,05214.9%27,83925,29910.0%
#3Nissan Altima54,88253,3642.8%28,47430,849-7.7%
#4Honda Accord42,62745,226-5.7%21,61624,622-12.2%
#5Ford Fusion42,42644,615-4.9%22,73223,898-4.9%
#6Honda Civic39,73743,399-8.4%21,03821,575-2.5%
#7Chevrolet Cruze36,99438,664-4.3%18,30121,836-16.2%
#8Ford Focus32,49727,92916.4%14,01915,926-12.0%
#9Chrysler 20029,96222,95830.5%15,80512,04631.2%
#10Nissan Sentra29,74921,46638.6%15,35412,33924.4%
#11Hyundai Elantra27,94831,719-11.9%15,70816,393-4.2%
#12Hyundai Sonata26,35021,00525.4%13,98711,19025.0%


Pickup Trucks

Click Column Headers To Sort • January 2015 • February 2014

RankBest-Selling TruckFebruary
2015
February
2014
%
Change
2015
YTD
2014
YTD
%
Change
#1
55,236
55,882-1.2%109,606102,4187.0%
#2
45,395
36,58424.1%81,50165,51024.4%
#331,29829,3036.8%59,91654,37410.2%
#4
15,157
14,2326.5%27,77825,3509.6%
#5
12,372
10,94213.1%23,78120,78414.4%
#6
9052
792314.2%17,24915,8139.1%
#7
6563
1656,200%12,5051583,266%


U.S. Vehicle Sales Rankings

Click Column Headers To Sort • January 2015 • February 2014

RankVehicleFebruary 2015 YTDFebruary 2014 YTD%
Change
2015 YTD2014 YTD% Change
#1Ford F-Series109,606102,4187.0%55,23655,882-1.2%
#2Chevrolet Silverado81,50165,51024.4%45,39536,58424.1%
#3Ram P/U59,91654,37410.2%31,29829,3036.8%
#4Toyota Camry59,70552,33014.1%32,94228,99813.6%
#5Toyota Corolla55,19648,05214.9%27,83925,29910.0%
#6Nissan Altima54,88253,3642.8%28,47430,849-7.7%
#7Honda CR-V45,50938,99116.7%22,29820,7597.4%
#8Honda Accord42,62745,226-5.7%21,61624,622-12.2%
#9Ford Fusion42,42644,615-4.9%22,73223,898-4.9%


USA Auto Sales Brand Rankings

January 2015 • February 2014 • Updated at 3:53 PM AT on 03.03.2015

RankAutomaker
February
2015
 ▴
%
Change
2015
YTD
%
Change
February
2015
Market
Share
YTD
Market
Share
#1
Ford
173,509
-1.8%
344,331
6.2%
13.8%
14.3%
#2
159,788
3.8%
302,670
10.9%
12.7%
12.6%
#3
153,608
13.0%
295,981
13.6%
12.2%
12.3%
#4
106,777
1.1%
201,226
7.5%
8.5%
8.3%
#5
92,474
4.1%
182,676
7.7%
7.3%
7.6%
#6
55,642
21.0%
107,165
22.0%
4.4%
4.4%
#7
52,505
7.1%
97,010
4.3%
4.2%
4.0%
#8
44,030
6.8%
82,329
5.2%
3.5%
3.4%
#9
42,433
19.3%
78,104
23.4%
3.4%
3.2%
#10
42,115
-15.3%
77,462
-8.5%
3.3%
3.2%


Posted by 쁘레드