경제이야기/Stock2015. 5. 31. 08:43

[이전 날짜는 20150315 였습니다.]

그동안 아주 관심있는 종목이 변하진 않았네요. 다만 투자중인 Nuance가 좋은 성적을 내고 있어서 좋고, QCOM은 좋은 가격에 매각을 잘 해서 좋고요. Delta(DAL)는 손실구간으로 들어갔네요. 아마도 물타기 좀 해야할것 같고요. Ford가 어닝을 들으며 6개월간 이거 큰일인데 하는 마음이었는데 어떻게 할 좋은 방도가 생각이 안나네요. 계속 배당이라도 나와주니까 받아먹으며 버텨야지요.


----------------------

NameSymbolLast priceMkt capAvg vol52wk high52wk lowEPSP/EBeta
QUALCOMM, Inc.QCOM69.68113.55B10.92M81.9762.264.2216.511.19
Apple Inc.AAPL130.28750.55B52.53M134.5488.92868.0916.110.84
Delta Air Lines, Inc.DAL42.9435.05B12.10M51.0630.121.4130.360.79
Tesla Motors IncTSLA250.831.70B4.60M291.42181.4-3.17na0.63
Ford Motor CompanyF15.1860.33B24.02M18.1213.260.7819.451.53
Nuance Communications...NUAN16.875.29B2.61M19.6113.2-0.38na1.07
Goodyear Tire & Rubber...GT31.848.60B4.47M32.5118.879.893.222.16
Alcoa IncAA12.5115.29B19.21M17.7512.440.5223.891.62
Hanwha Q Cells Co Ltd...HQCL2.17216.26M467,282.002.840.92-1.11na2.54
eBay IncEBAY61.3674.54B7.04M61.6446.342.3825.740.85
Yahoo! Inc.YHOO42.9440.29B16.64M52.6232.93017.185.981.1
Alibaba Group Holding...BABA89.38223.05B20.44M12077.771.8249.19
Petroleo Brasileiro...PBR8.3652.81B42.39M20.944.9-1.13na1.88
Semicond. Manufacturing...SMI5.664.14B72,135.006.063.880.2423.341.3
Intel CorporationINTC34.46163.48B24.53M37.926.932.3514.640.95
NXP Semiconductors NVNXPI112.2528.26B3.12M112.8153.812.1751.682.65
Palo Alto Networks IncPANW169.5814.19B1.34M169.8472-1.88na
iRobot CorporationIRBT31.95949.69M394,162.004228.051.2325.91.82

--------------------


3/15일 대비 수익율인데, 어마어마한 상승을 보여주는 종목이 많네요. 그남아 뉴앙스라도 들고 있다는데에 의의를 둬야할듯. 가진 종목중에 마이너스도 있고요. 헐~

NameSymbolLast price
of 2015/05/29
Last price
of 2015/03/15
Change
QUALCOMM, Inc.QCOM69.6868.641.52
Apple Inc.AAPL130.28123.595.41
Delta Air Lines, Inc.DAL42.9445.5-5.63
Tesla Motors IncTSLA250.8188.6832.92
Ford Motor CompanyF15.1816.2-6.30
Nuance Communications...NUAN16.8713.8721.63
Goodyear Tire & Rubber...GT31.8425.2426.15
Alcoa IncAA12.5113.57-7.81
Hanwha Q Cells Co Ltd...HQCL2.171.1195.50
eBay IncEBAY61.3659.073.88
Yahoo! Inc.YHOO42.9442.870.16
Alibaba Group Holding...BABA89.3881.869.19
Petroleo Brasileiro...PBR8.365.0166.87
Semicond. Manufacturing...SMI5.664.331.63
Intel CorporationINTC34.4630.9311.41
NXP Semiconductors NVNXPI112.25104.677.24
Palo Alto Networks IncPANW169.58141.3419.98
iRobot CorporationIRBT31.9533.01-3.21


'경제이야기 > Stock' 카테고리의 다른 글

3 stocks to buy if the market crashes  (0) 2015.06.17
한화큐셀 HQCL ADR ratio change  (0) 2015.06.01
Delta Airlines, DAL  (0) 2015.05.31
Nuance, NUAN 추천  (0) 2015.05.31
IRobot, IRBT  (0) 2015.05.31
Posted by 쁘레드
자동차이야기2015. 4. 9. 23:54

*트럭판매가 증가하고 있다고 합니다.

 제가 좋아하는 Ford는 증가는 하고 있지만 3월판매가 작년보다 안좋네요. 헉~

Click Column Headers To Sort • February 2015 • March 2014

Rank

Best-Selling Truck

March
2015

March
2014

%
Change

2015
YTD

2014
YTD

%
Change

#1

Ford F-Series

67,706

70,940

-4.6%

177,312

173,358

2.3%

#2

Chevrolet Silverado

45,193

42,247

7.0%

126,694

107,757

17.6%

#3

Ram P/U

41,595

42,532

-2.2%

101,511

96,906

4.8%

#4

GMC Sierra

17,395

16,863

3.2%

45,173

42,213

7.0%

#5

Toyota Tacoma

15,885

14,445

10.0%

39,666

35,229

12.6%

#6

Toyota Tundra

11,508

11,589

-0.7%

28,757

27,402

4.9%

#7

Nissan Frontier

7128

7140

-0.2%

19,102

17,862

6.9%

#8

Chevrolet Colorado

6621

2

330,950%

19,126

17

112,406%

#9

GMC Canyon

2434

1

243,300%

7152

2

357,500%

#10

Nissan Titan

1048

1314

-20.2%

2638

3318

-20.5%

#11

Honda Ridgeline

77

1538

-95.0%

427

3844

-88.9%

#12

Cadillac Escalade EXT

---

8

-100%

2

42

-95.2%

#13

Chevrolet Avalanche

---

11

-100%

---

68

-100%

---

---

---

---

---

---

---

---

---

Total

216,590

208,630

3.8%

567,560

508,018

11.7%


*자동차 메이커 별로는

선두업체중 도요타와 닛산의 약진이 두드러지게 보이네요. 현대도 평균이상의 판매량증가가 돕보입니다. 일본차의 엔저영향이 점점 심해지고 있는 상황인데도 잘하고 있네요. Ford는 힘을 못쓰고. 일본차 중에는 혼다가 부진하네요.

February 2015 • March 2014 • Updated at 4:21 AM AT on 04.01.2015

Rank

Automaker

March
2015

%
Change

2015
YTD

%
Change

March
2015
Market
Share


YTD
Market
Share

#1

Ford

226,091

-3.6%

570,422

2.1%

14.6%

14.4%

#2

Toyota

190,481

5.3%

486,462

10.2%

12.3%

12.3%

#3

Chevrolet

173,886

-3.2%

476,556

5.3%

11.2%

12.0%

#4

Nissan

132,560

-3.0%

333,786

3.1%

8.6%

8.4%

#5

Honda

111,623

-5.2%

294,299

2.4%

7.2%

7.4%

#6

Hyundai

75,019

12.0%

172,029

7.5%

4.9%

4.3%

#7

Jeep

71,584

23.5%

178,749

22.6%

4.6%

4.5%

#8

Kia

58,771

7.3%

141,100

6.1%

3.8%

3.6%

#9

Subaru

49,111

10.4%

131,281

16.8%

3.2%

3.3%

#10

Dodge

46,049

-24.0%

123,511

-15.0%

3.0%

3.1%

#11

Ram

45,023

1.2%

110,406

9.3%

2.9%

2.8%

#12

GMC

41,707

1.3%

119,811

14.7%

2.9%

3.0%

#13

BMW

34,310

6.9%

78,492

8.4%

2.2%

2.0%

#14

Mercedes-Benz

32,300

10.2%

83,715

8.4%

2.1%

2.1%

#15

Mazda

32,123

-8.0%

78,044

-0.1%

2.1%

2.0%

#16

Lexus

31,054

8.6%

77,180

18.6%

2.0%

2.0%

#18

Volkswagen

30,025

-18.2%

79,239

-9.3%

1.9%

2.0%


*자동차 모델별로는

역시 선두권 중에서는 토요타와 닛산이 잘하고 있네요. 엔저로 강력한 마케팅이 도움이 되고 있습니다. 캠리는 부동의 1위지만, 코롤라의 증가가 뛰어납니다. 코롤라가 잘 나온듯 보이네요. 현대중에서는 아반테(Elantra)가 점점 많이 팔리네요. 기름값이 많이 내려간것 생각하면 작은차가 많이 팔리는 상황은 미국 사람들의 라이프 스타일도 변하고 있다고 보여집니다. 포드는 왜그러는지, 혼다도 힘내고. 소나타는 힘을 못쓰는군요. 가격도 많이 내렸는데...

February 2015 • March 2014

Rank
Best-Selling Car
March
2015
March
2014
%
Change
2015
YTD
2014
YTD
%
Change
#1
Toyota Camry
40,80041,953-2.7%100,50594,2836.6%
#2
Toyota Corolla
35,53229,68519.7%90,72877,73716.7%
#3
Nissan Altima
31,99335,921-10.9%86,87589,285-2.7%
#4
Ford Fusion
29,04432,963-11.9%71,47077,578-7.9%
#5
Hyundai Elantra
28,79421,51833.8%56,74253,2376.6%
#6
Honda Civic
26,09527,697-2.6%66,72271,096-6.2%
#7
Honda Accord
26,01833,962-23.4%68,64579,188-13.3%
#8
Chevrolet Cruze
23,59326,521-11.0%60,59265,185-7.0%
#9
Nissan Sentra
21,27719,32310.1%51,02640,78925.1%
#10
Ford Focus
20,49723,974-14.5%52,99451,9032.1%
#11
Chrysler 200
19,1907531155%49,15230,48961.2%
#12
Hyundai Sonata
18,34019,248-4.7%44,69040,25311.0%
#13
Chevrolet Malibu
16,55218,866-12.3%42,40148,136-11.9%
#14
Kia Optima
15,48516,310-5.1%36,46337,515-2.8%
#15
BMW 3-Series & 4-Series
14,83510,12046.6%30,93124,40526.7%
#16
Nissan Versa
14,54315,799-7.9%36,99834,6036.9%
#17
Kia Soul
12,73113,992-9.0%30,83832,668-5.6%
#18
Ford Mustang
12,663930536.1%29,81119,59652.1%
#19
Subaru Outback
12,50411,7296.6%35,48728,92622.7%
#20
Volkswagen Jetta
11,58315,692-26.2%31,36337,368

-16.1%


YTD 판매량 랭킹으로 보면
Click Column Headers To Sort • February 2015 • March 2014
RankCarMarch 2015 YTDMarch 2014 YTD%
Change
March
2015
March
2014
% Change
#1Toyota Camry100,50594,2836.6%40,80041,953-2.7%
#2Toyota Corolla90,72877,73716.7%35,53229,68519.7%
#3Nissan Altima86,87589,285-2.7%31,99335,921-10.9%
#4Ford Fusion71,47077,578-7.9%29,04432,963-11.9%
#5Honda Accord68,64579,188-13.3%26,01833,962-23.4%
#6Honda Civic66,72271,096-6.2%26,98527,697-2.6%
#7Chevrolet Cruze60,59265,185-7.0%23,59826,521-11.0%
#8Hyundai Elantra56,74253,2376.6%28,79421,51833.8%
#9Ford Focus52,99451,9032.1%20,49723,974-14.5%
#10Nissan Sentra51,02640,78925.1%21,27719,32310.1%
#11Chrysler 20049,15230,48961.2%19,1907,531155%
#12Hyundai Sonata44,69040,25311.0%18,34019,248-4.7%
#13Chevrolet Malibu42,40148,136-11.9%16,55218,866-12.3%
#14Nissan Versa36,99834,6036.9%14,54315,799-8.0%
#15Kia Optima36,46337,515-2.8%15,48516,310-5.1%
#16Subaru Outback35,48728,92622.7%12,50411,7296.6%
#17Volkswagen Jetta31,36337,368-16.1%11,58315,692-26.2%

*SUV 경우

February 2015 • March 2014

Rank
Best-Selling SUV/Crossover
March
2015
March
2014
%
Change
2015
YTD
2014
YTD
%
Change
#1
Honda CR-V
27,61828,657-3.6%73,12767,6488.1%
#2
Nissan Rogue
27,41819,42041.2%64,48650,44827.8%
#3
Ford Escape
26,30328,701-8.4%67,27271,305-5.7%
#4
Toyota RAV4
25,24319,73327.9%67,01053,06426.3%
#5
Chevrolet Equinox
24,33519,93922.0%65,61356,07317.0%
#6
Ford Explorer
23,05819,33419.3%58,70746,06827.4%
#7
Jeep Cherokee
19,03313,79638.0%48,21336,09633.6%
#8
Jeep Wrangler
17,52414,48121.0%42,11834,67421.5%
#9
Jeep Grand Cherokee
16,81515,9405.5%43,37740,8386.2%
#10
Subaru Forester
14,96713,8468.1%37,63635,3906.4%
#11
Toyota Highlander
13,03913,0190.2%35,36235,747-1.1%
#12
Honda Pilot
11,937889434.2%36,88122,03167.4%
#13
Jeep Patriot
11,849843140.5%29,69220,47445.0%
#14
Chevrolet Traverse
11,103942117.9%30,95922,36238.4%
#15
Mazda CX-5
10,89911,855-8.1%24,29326,206-7.3%
#16
Kia Sorento
10,842867125.0%26,90323,00616.9%
#17
Hyundai Santa Fe
989597261.7%26,40623,44012.7%
#18
Ford Edge
940512,862-26.9%23,51233,238-29.3%
#19
Dodge Journey
922291251.1%23,98223,0244.2%
#20
Toyota 4Runner
8648706222.5%22,01315,68240.4%


Posted by 쁘레드
경제이야기/Stock2015. 3. 17. 05:46

GM이 미리 중국에 진출에서 좋은 성과를 낸것은 잘한것 같다. Ford도 최근에 높은 성장률을 보이고 있으니 이것도 다행이고. 둘 비교는 의미가 크다.

이번년 중국의 성장률이 7%도 어려울듯 한데, 자동차 산업은 어떨지 또 궁금. 내수를 살릴 생각이면 중국내 자동차 판매에 도움이 되겠지만, 공해문제 해소에 초점을 마추면 자동차 판매는 쉽지 않을것 같고.


------------------------

How Ford And GM Compare In China

Summary

  • Ford is behind GM in China, although recent sales figures seem to favor the former.
  • In absolute numbers, GM remains ahead of Ford and gives it a big advantage.
  • GM shouldn't take its current position for granted because things can always change.

Ford (NYSE:F) and GM (NYSE:GM) are the two most prominent car manufacturers from the United States. Throughout their long history together, they have competed with one another and the two can be considered rivals. Neither of the two companies has a clear advantage over the other to be number one in the United States. They go back and forth as time goes by.

With that said, it can be argued that Ford has been the better of the two in recent years. For instance, while GM needed a massive government bailout to recover from bankruptcy at the height of the Financial Crisis in 2008/2009, Ford did much better and was able to keep its problems more or less under control.

However, the one consistent and constant advantage that GM has had over Ford is in the Chinese market. In China, GM is way ahead of Ford by a huge margin. Some of GM's brands such as Buick are doing very well there, even though they may be struggling elsewhere. That helps illustrate the level of success GM has managed to achieve in China.

The trend in China may be changing in favor of Ford

GMUnit Sales% Change (Y/Y)
January 2015339,781-2.4
February 2015261,0721.3

Source: GM releases

FordUnit Sales% Change (Y/Y)
January 2015112,59919
February 201579,3848.7

Source: Ford releases

Recent sales figures from GM and Ford in collaboration with their Chinese partners seem to suggest that this advantage may be slipping. In fact, GMsales in China are actually down in comparison to the previous year. Ford, on the other hand, is doing much better with significant sales increases. Some would therefore argue that Ford is gaining on GM in a market where it has long trailed.

Ford versus GM in China

The latest sales figures come on the heels of other reports which indicate that Ford increased sales last year by over 19 percent in China. GM also did well with a 12 percent increase, but that's substantially below that of Ford. The tables below show the performance of GM and Ford over the last several years.

Furthermore, Ford has beaten GM for the last three years using this metric. You would have to go all the way back to 2011 for the last time that GM was able to post a higher number than Ford. It would seem that a pattern is beginning to appear.

GMUnit SalesUnit Increase% Increase
20091,826,424  
20102,351,610525,18628.8
20112,547,171195,5618.3
20122,836,128288,95711.3
20133,160,377324,24911.4
20143,539,970379,59312.0
FordUnit SalesUnit Increase% Increase
2009440,619  
2010483,28842,6699.6
2011519,39036,1027.4
2012626,616107,22620.6
2013935,812309,19649.3
20141,114,669178,85719.1

The market in China continues to grow

With China now being the largest market in terms of vehicles sold, it's important for automakers to do well there as best as they can. No car manufacturer can aspire to be number one globally without also having a strong position in China. Especially not with the Chinese market continuing to grow at a strong clip.

The China Association of Automobile Manufacturers ("CAAM") forecasts sales to grow by around 7 percent in 2015 to 25.1 million vehicles. That continues the steady expansion of the market as seen in recent years. The table below shows the total number of vehicles sold in the preceding years.

 Unit Sales (in millions)% Increase
200913.64 
201018.0632.4
201118.52.4
201219.314.4
201321.9913.9
201423.56.9

Source: CAAM

Is Ford really doing better than GM in China?

It's important to note that while Ford may be posting higher sales figures than GM in terms of percentages, its sales are coming off a much lower base. Therefore, GM sales may seem smaller because the base is so much bigger. Ford's increases in percentages may seem bigger, but they also translate into much smaller increases in absolute terms.

Taking a closer look at the sales statistics shows that while Ford may have increases sales last year by over 19 percent and GM by 12 percent, GM sold 379,593 more vehicles. Ford had 178,857 more vehicles. In other words, GM sales increase in absolute numbers is more than twice that of Ford, even though Ford increased its sales by a higher percentage.

Conclusion

Bottom line, GM is still comfortably ahead of Ford in China despite the progress Ford has made. Even though Ford last year managed to sell more than one million vehicles for the first time in China, GM managed to do that a long time ago and is now at more than 3.5 million vehicles. GM's unit sales are easily over three times that of Ford. China remains a strength of GM.

Granted, GM had a headstart because it entered the Chinese market before Ford did. GM first entered China in the early part of the twentieth century and re-entered the market in the mid nineties. Compared to Ford's greater reluctance, GM placed much stronger emphasis on China than Ford did.

The former is now reaping the benefits of its decision and Ford is forced to play catch up in a market that GM projects could grow to 35 million (passenger and commercial) vehicles by 2020. If this turns out to be accurate, GM will be in an excellent position to take advantage and eclipse the competition.

To Ford's credit, it has managed to make impressive strides even though it's behind. For instance, it has managed to beat Japanese manufacturers such as Toyota (NYSE:TM) and has now surpassed them in sales. The key is to keep up the effort and it's possible that for Ford the best is yet to come.

With all that said, GM should not become complacent even if it doesn't have to worry too much about Ford. Frequent recalls like you have now and other technical defects don't exactly help your reputation when you're selling a product.

GM therefore shouldn't take its current position for granted. It would not be the first time that an automaker lost its leading position. After all, just because you're ahead in the race doesn't mean you've also won the race. The race is far from over.


Posted by 쁘레드
경제이야기/Stock2015. 3. 17. 05:41

Ford가 undervalue되어있어 130% 더 오를수 있다는 얘기. Stock Buy back을 더 해줘야 한다는데... 흐뭇해지는 얘기지만 현실성은 좀 부족하네요. 이친구는 어떤게 계산하는지 따라해봐야겠네요.


----------------------

Long/short equity, special situations
Profile| Send Message| 
 ( followers)  

Summary

  • Ford Motor is substantially undervalued on a free cash flow basis.
  • I calculate an intrinsic value of $37 based on Ford Motor's free cash flow to equity and based on moderate growth assumptions.
  • Ford should follow General Motors' lead and announce a voluminous stock buyback.
  • Ford Motor's shares have more than 130% upside potential.

Ford Motor (NYSE:F) is one of the most undervalued companies in the stock market right now. Ford Motor does not only offer a solid dividend yield of 3.70%, but also substantial capital appreciation potential. In order to calculate Ford Motor's intrinsic value, I have derived Ford Motor's free cash flow to equity, a measure that shows how much cash is available for return to shareholders. The free cash flow to equity includes debt cash flows, debt proceeds and repayments, which are easily pulled from the firm's 10-K filing with the SEC.

General Motors (NYSE:GM) recently announced a major share buyback program, about which I wrote here. Share buybacks are financed out of a company's free cash flow to equity, which is why I use this measure to calculate Ford's indicative fair value.

Intrinsic value estimate

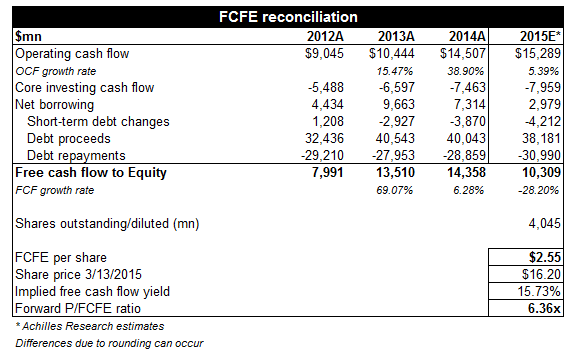
The table below contains Ford Motor's operating-, core investing- (capital expenditures, no inclusion of finance receivables, operating leases and sales/purchases of marketable securities) and debt cash flows from Ford Motor's cash flow statements for the years 2012-2014 (Source: Recent Ford Motor 10-K SEC filing). The table also includes my cash flow estimates for 2015.

The free cash flow to equity sums up operating, investment and debt-related cash flows. The resulting free cash flow to equity depicts the amount of cash that can be distributed to shareholders in the form of dividends and share buybacks.

I estimate that Ford Motor will be able to rake in $10.3 billion in free cash flow to equity in 2015, part of which is driven by positive net borrowings. On a per share basis, I estimate that Ford Motor can earn approximately $2.55 in FCFE in 2015, which translates into a P/FCFE ratio of just 6.4x. In other words, given the assumptions outlined below, Ford Motor's share price currently implies a near 16% FCFE yield.

(click to enlarge)

Source: Achilles Research, Company Financials
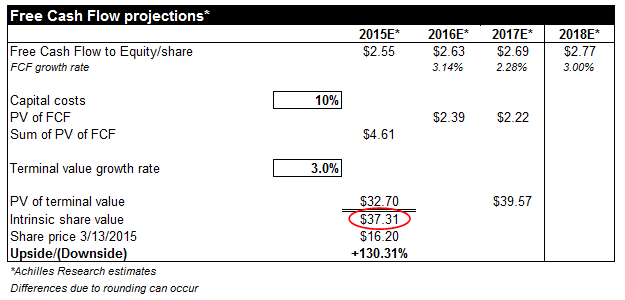
Using the derived free cash flow to equity per share as the basis for a discounted cash flow valuation model leads to the conclusion that Ford Motor is substantially undervalued.

Assuming moderate free cash flow to equity growth rates of about 3% in the short- and long-term, and applying an equity cost of capital rate of 10%, a two-stage FCFE valuation model leads to an intrinsic value of $37 per Ford share.

(click to enlarge)Source: Achilles Research, Company Financials

This high a value is not necessarily astonishing, because both operating cash flows and net borrowings are key drivers of the FCFE. Further, Ford Motor has had great success in growing operating cash flow: In the last year alone, Ford grew cash flow from operating activities by 39%.

Ford's high free cash flows lead to an intrinsic value that is way above its current share price of $16. Consequently, I think Ford Motor should follow General Motors lead here and announce a $10 billion share buyback to make better use of its cash. Ford can surely afford it.

Your Takeaway

Not everybody has to agree with the use of a FCFE valuation model for an auto manufacturer or with the growth assumptions embedded in such model. The derived value is an indicative fair value only.

However, the model goes to show that Ford Motor is substantially undervalued on a free cash flow to equity basis and that the company has a lot of resources available to fund stock buybacks.

Last but not least, Ford's free cash flow strength provides investors with a very wide margin of safety. Strong Buy.


'경제이야기 > Stock' 카테고리의 다른 글

F How Ford And GM Compare In China  (0) 2015.03.17
AA This Is Not The Same Alcoa  (0) 2015.03.17
20150315 아주 관심있는 종목 리스트  (0) 2015.03.16
Kiplinger's 2015 Feb - Future stock 추천  (0) 2015.03.15
유럽동향 2015/03/12  (0) 2015.03.13
Posted by 쁘레드
경제이야기/Stock2015. 3. 16. 09:47

년초에 1년목표 수익률을 다 달성해 놓는것이 어깨에 힘빼고 치기에 좋은데, 이번년은 벌써 3월인데 녹녹치 않네요.

NXP Semiconductors는 작년말에 들어갔어야 했는데, 다른데 정신이 팔려있어서 좋은 보석을 놓쳤네요. 추가 상승여지가 얼마나 있는지 잘 생각해봐야 하겠네요.


NameSymbolLast priceMkt capVolumeAvg vol52wk high52wk lowEPSP/EBetaEBITDA Cur Ratio
QUALCOMM, Inc.QCOM68.64113.23B13.95M13.65M81.9762.264.7314.511.229.38B3.55
Apple Inc.AAPL123.59719.88B51.83M59.79M133.673.04717.4216.650.8767.66B1.13
Intel CorporationINTC30.93146.48B47.95M30.43M37.924.42.3213.320.9524.19B1.73
Delta Air Lines, Inc.DAL45.537.50B10.04M12.42M51.0630.120.7659.80.826.91B0.74
Tesla Motors IncTSLA188.6823.73B5.43M5.49M291.42177.22-2.35n/a0.645.24M1.48
Ford Motor CompanyF16.264.09B27.88M27.14M18.1213.260.7920.441.5311.21B1.74
Nuance Communications...NUAN13.874.51B1.50M2.18M19.6113.2-0.46n/a1.14186.74M1.92
Goodyear Tire & Rubber...GT25.246.80B2.33M3.52M28.9818.878.842.852.092.25B1.63
Alcoa IncAA13.5716.59B16.91M22.39M17.7511.610.266.751.583.561.48
eBay IncEBAY59.0771.48B7.87M8.06M60.9346.340.051,144.550.915.04B1.51
Yahoo! Inc.YHOO42.8740.13B9.09M14.61M52.6232.157.455.751.11682.48M2.14
Alibaba Group Holding...BABA81.86203.61B12.66M15.84M12080.031.845.494.74B2.7
Semicond. Manufacturing...SMI4.33.09B31,041.0073,249.005.483.740.1922.111.43671.27M1.58
NXP Semiconductors NVNXPI104.6726.35B8.27M4.05M105.1253.812.1748.192.751.47B2
Palo Alto Networks IncPANW141.3411.63B958,853.001.48M149.349957.4712-3.28n/a-76.94M2.08
iRobot CorporationIRBT33.01979.48M623,229.00583,000.0045.0928.051.2526.361.7465.37M3.79
Petroleo Brasileiro...PBR5.0133.48B56.84M45.56M20.944.90.935.381.8822.17B1.7
Hanwha Q Cells Co LtdHQCL1.11110.50M556,940.00352,504.003.970.92-1.24n/a2.8759.40M1.85


'경제이야기 > Stock' 카테고리의 다른 글

AA This Is Not The Same Alcoa  (0) 2015.03.17
F Ford Motor Could Be Worth Up To $37 Per Share  (0) 2015.03.17
Kiplinger's 2015 Feb - Future stock 추천  (0) 2015.03.15
유럽동향 2015/03/12  (0) 2015.03.13
20150308 BioTech 추천주  (0) 2015.03.09
Posted by 쁘레드