AI 매출이 폭발적으로 증가하리라는 기대가 주가의 방향과 기울기를 결정할것이기 때문에 다른 뉴스보다는 AI관련 매출과 Margin을 봐야 합니다.
리사수는 2024년도 AI관련 매출을 $2B으로 상당히 보수적으로 발표하면서 사람들 깜짝 놀래켰는데요, $4B까지는 가능하다는 것이 시장 예상입니다. Reddit의 한 user는
https://www.reddit.com/r/AMD_Stock/comments/18gx11e/mi300_400000_unit_20k_price_and_60_gm/
From the AMD_Stock community on Reddit: MI300 - 400,000 Unit @ $20K price and 60% GM
Explore this post and more from the AMD_Stock community
www.reddit.com
https://www.financetldr.com/p/2024-is-amds-year-heres-why
2024 is AMD's Year. Here's Why.
In this newsletter issue we share our thesis and price target for AMD in 2024.
www.financetldr.com
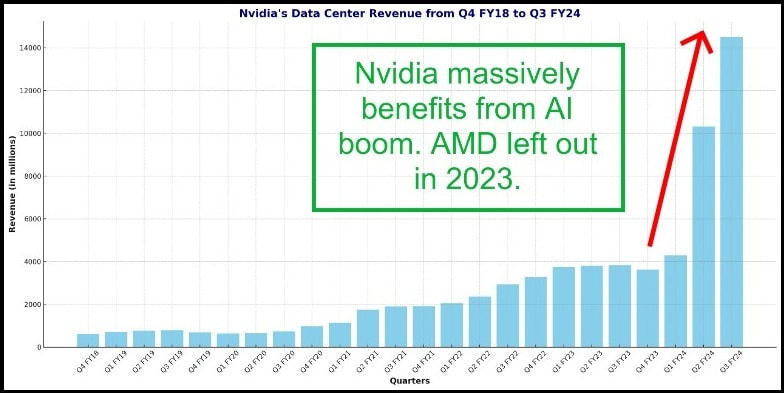
NVidia가 2023년에 ChatGPT열풍으로 매출이 달나라로 갈때 AMD는 전혀 수혜를 받지 못했는데 내년 MI300 family 매출 6B, 그후 10B 20B이런식으로 급속도로 늘어날 것으로 예상되기 때문에 상당히 매력적인 성장주식중 하나로 보인다. Lisa Su는 2027년까지 AI Market size가 $400B로 예측했는데 AMD가 30%면 120B, 20% 라면 80B인데, 2023년 AMD총 매출이 $22B 임을 감안할때 매출 100B돌파가 2-3년 내에 가능할것으로 보입니다.
TSMC의 chip-on-wafer-on-substrate (CoWoS) packaging 캐파를 2024년말까지 2배로 늘린다는 것도 호재입니다. 알려진 바에 따르면 TSMC의 advance package가 칩 생산의 병목입니다. 이를 두배로 늘린다는 이야기는 Apple, nVidia, AMD에게는 호재입니다. 특히 AMD chiplet구조가 수율이 좋기때문에 수요만 꾸준히 있으면 매출을 늘리기는 다른 경쟁사 보다 더 쉬울 것으로 보입니다.
AMD Is Still Being Underestimated (NASDAQ:AMD)
AMD is in two very critical industries where they have a strong competitive presence. Click here to read why AMD still has a shot at challenging NVIDIA's lead.
seekingalpha.com
https://www.reddit.com/r/AMD_Stock/comments/18q0oad/amd_2025_revenue_estimate/
From the AMD_Stock community on Reddit
Explore this post and more from the AMD_Stock community
www.reddit.com
AMD MI300 family를 module로 만들고 base board와 함께 만드는 대만 회사는 Wistron. AI관련 기판은 독점에 가까운 회사라 이회사의 실적을 잘 track해도 Nvidia/AMD/Intel의 AI관련 매출을 파악하는데 도움이 될듯함.
> AMD AI chip shipments are expected to be 350,000–400,000 units for 2024. [=$6B~$8B revenue]
From the AMD_Stock community on Reddit: 緯創為2024年AI伺服器晶片競爭的主要贏家 / Wistron is the main winner of t
Explore this post and more from the AMD_Stock community
www.reddit.com
'경제이야기 > Stock' 카테고리의 다른 글
| AMD $300B $200 milestone reached (0) | 2024.03.02 |
|---|---|
| 요즘 거래량 거래금액이 많은 미국주식 (0) | 2023.12.27 |
| 이번주 미국주식 어닝 2023/10/30 주 (0) | 2023.10.31 |
| 이번주 미국 주식 실적발표 (0) | 2023.10.24 |
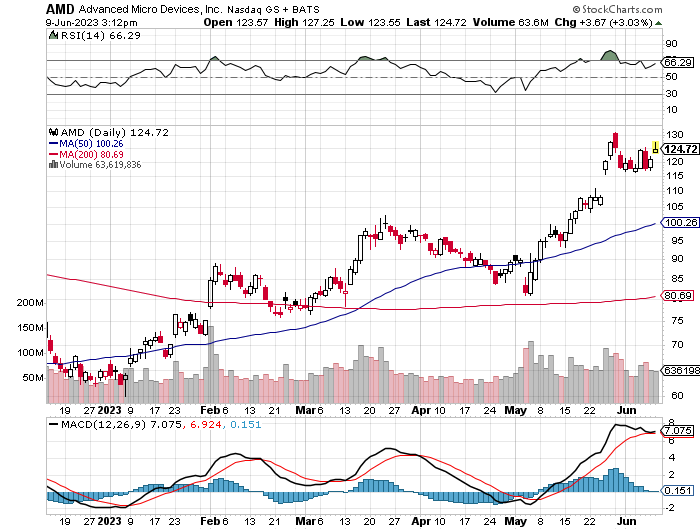
| 주식차트 예쁘게 그려준다는 tradingview.com (0) | 2023.06.10 |