자동차이야기2015. 3. 18. 05:45

동네에서 멀지 않은 toyota 매장 website에 들어갔더니. 엄청나게 싼 리스(lease) deal들이 대문앞에 쫙 있습니다. 샌디에고는 대도시는 아니라 최저가격이 아니니 LA쪽에서 알아보면 더 좋은 딜들이 많을것 같습니다.


미국에서 가장 많이 팔리는 자동차중 하나인 camry가 그것도 LE가 아닌 SE가 $99 + 3999(down)인것은 처음보네요. 3년 총 비용이 $7600으로 제 기준으로 비싸지만(!) lease관념으로 상당히 저렴합니다. 한달에 $211 정도니까요.


엔저를 무기로 일본자동차의 파상공세와 떨어진 유로화를 등에업은 유럽자동차들의 공습까지... 재밌는 시장입니다.

다음에는 현대 광고를 찾아서 올려드리죠. 소나타(sonata)도 새로운 모델이 나오자마다 상당히 공격적으로 가격을 많이 낮쳤는데 지금은 더 낮쳐야 할것 같음.


'자동차이야기' 카테고리의 다른 글

Toyota Engine Excessive Oil Consumption  (0) 2015.03.25
미국 현대자동차 공격적 가격  (0) 2015.03.20
한국 luxury car sales  (0) 2015.03.14
2015.03 (March) US Auto Sales  (0) 2015.03.08
애플카에 대한 생각, Apple Car  (0) 2015.03.04
Posted by 쁘레드

요즘은 자주 안올리시지만, 클래식 음악에 대한 설명과 간간히 읽어주는 책에서 감성에 젖은 분위기 있는 목소리를 만날수 있습니다. 그날의 주제가 있는데 아무것도 모르는 제가 듣기에 참 좋습니다.

우리 와이프는 남자 목소리가 별로라긴 하던데. 저는 다 받아놓고 local play로 가끔씩 조용할때 듣습니다.


바이올린을 사랑하는 친구에게 – 이창주

http://www.podbbang.com/ch/4556

Posted by 쁘레드

음악 팟캐스트 추천. 팟캐스트 이름답게 서울역 낡은 음악다방에서 틀었을법한 음악들이 주욱 흘러나옵니다. 누가하시는지 모르겠지만 인사만 하고 음악도 나옵니다. 끝까지는 다 안들어봐서 끝에 인사하고 끝나는지는 모르겠습니다. ^^ 무슨 음악듣지할때 강추.


서울역 낡은 음악다방

http://www.podbbang.com/ch/8434

CCL.EP_10. 이밤에 혼자걷다 듣고 싶은...

2015.03.15 00:52:35 18

CCL.EP_9. 니가 치던 그 낡은 피아노

2015.03.15 00:34:50 16

CCL.EP_8. 커피향기 가득한 오후

2015.03.14 00:56:29 24

CCL.EP_7. 보내지 못한 오래된 편지

2015.03.13 01:02:24 50

CCL.EP_6. 어느 토요일 늦은 6시에...

2015.03.13 00:58:43 46

CCL.EP_5. 혼자 걷는 이 길은...

2015.03.07 00:58:04 44

CCL.EP_4. 햇살 가득한 겨울창가에 앉아서...

2015.03.07 00:55:52 43

CCL.EP_3. 바람이 몹시불던 날

2015.03.07 00:56:03 43

CCL.EP_2. 봄인가요?

2015.03.07 00:51:26 43

CCL.EP_1.음악은 마음으로 듣는거랍니다.

2015.03.07 00:47:39 44


Posted by 쁘레드
IT이야기2015. 3. 17. 15:23

소니 4K Camcorder에 관심을 가지던중 한국분이 하시는 YouTube channel을 알게됐는데, 자신의 ultimate 4k video setup을 소개해 놓으셨다. 이분이 여러 장비를 try해보다가 여기에 settle한것 처럼, GH4에 Metabones로 캐논 mount lens를 붙이는게 가장싼것 같다. 독립영화도 이정도 장비 두쌍만 가지고 있으면 상당히 좋은 quality로 찍을수 있을것 같다.


이분이 지불한 금액은 처음3개로 $2999 정도 되는데 이정도면 전문가 급으로 $20K 가치될듯.

렌즈를 좀더 싼 단렌즈로 선택하면 더 저렴할수 있다.

Metabones는 1 stop정도 더 올릴수 있게 해주는 장비인데 depth of field를 중요시 한다면 꼭 넣어야.


Source : http://highonandroid.com/my-camera-gear/

-----------------------

I will be updating my “perfect” 4K DSLR setup often, this is my current setup for the highest-quality 4K videos without having to spend $20K+ on camera equipment.

  • Panasonic Lumix DMC-GH4 – $1498 on Amazon – Link
  • Sigma 18-35mm F1.8 Lens – $799 on Amazon – Link
  • Metabones Speed Booster Adapter for Canon – $699 – Link
  • Sennheiser EW 112P – $630 on Amazon – Link
  • Manfrotto Travel Tripod – $199 on Amazon – Link
  • Manfrotto Fluid Head – $170 on Amazon – Link

-----------------------


좀더 작고 가정용으로 간단하게 사용하고 싶으면 역시 소니 캠코더를 사는게 좋을것 같다. 센서가 좀 작지만 편의사항이 많아 여자들도 잘 찍을수 있으니까.


Sony 4K HD FDRAX33 1/2.3 inyesyes$9994K support. Best quality, best value


AX33보다 더 전문가용으로 1인치 센서를 쓴 A100이 있긴한데, 가격과 크기가 가정용으는 어중간하다. 독립영화찍는 분이 가벼운 장비로 이용하기는 좋을듯.

Modelsensor sizeWIFIXAVCvalue
Sony FDR-AX1001 inyesyes$1,700


Posted by 쁘레드
IT이야기2015. 3. 17. 13:03

회사의 어떤 친구는 heart rate을 원하면서 일주일 배터리 가는거 찾으면 Fitbit Surge말고는 없다고 한다. 일주일도 못가는 것은 공짜로 줘도 오래 못쓴다.

심장박동 층정을 할수 있는 smart watch or band를 알아보려고 서치했더니 이런거 잘 정리해 놓은 사이트가 있다.


http://vandrico.com/device-categories/components/heart-rate-monitor


We define "Heart Rate Monitor" as a system made of sensors that measures and records the user's heart rate.

APPLE WATCH

WORN ON THE WRIST AND USED FOR LIFESTYLE & FITNESS APPLICATIONS.
The Apple Watch is Apple's first wearable device. It is a smart-watch with a retina display and circular dial on the side. Apple will...

SMS AUDIO BIOSPORT

WORN ON THE HEAD AND USED FOR FITNESS & LIFESTYLE APPLICATIONS.
The SMS Audio biosport earphones are wearable devices that provide body monitoring and . The earphones features a heart rate measuring...

LG G WATCH R

WORN ON THE WRIST AND USED FOR ENTERTAINMENTFITNESS & LIFESTYLE APPLICATIONS.
The LG Watch R is a fusion of the classic wristwatch designs with the current smartwatch technology. This wearable device provides access...

FITBIT SURGE

WORN ON THE WRIST AND USED FOR LIFESTYLE & FITNESS APPLICATIONS.
The Fitbit Surge is a fitness oriented smartwatch is able to display notifications and track activity and sleep. This wearable device...

FITBIT CHARGE HR

WORN ON THE WRIST AND USED FOR FITNESS & LIFESTYLE APPLICATIONS.
The Fitbit Charge HR is a fitness oriented smartband which is able to display notifications and track activity and sleep. This wearable...

MICROSOFT BAND

WORN ON THE WRIST AND USED FOR LIFESTYLE & FITNESS APPLICATIONS.
The Microsoft Band is a smartwatch designed to provide actionable health insights and push notifications to the user. The health insights...

OLIVE

WORN ON THE WRIST AND USED FOR LIFESTYLE APPLICATIONS.
The Olive bracelet is designed to provide the user with stress measurement and gives recommendations on how to manage that stress. This...

SAMSUNG GEAR LIVE

WORN ON THE WRIST AND USED FOR LIFESTYLE APPLICATIONS.
The Samsung Gear Live is an Android Wear powered smartwatch which provides pushed notifications and voice interaction with a tethered...

BASIS PEAK

WORN ON THE WRIST AND USED FOR FITNESS & LIFESTYLE APPLICATIONS.
The Basis Peak is a health and fitness tracker designed to analyse and record the number of steps taken, calories burned, heart rate,...

LIFEBEAM HELMET

WORN ON THE HEAD AND USED FOR FITNESS APPLICATIONS.
The LifeBEAM Helmet is an activity monitor in a bicycle helmet form factor. This wearable device uses aerospace grade optical heart rate...

LIFEBEAM HAT

WORN ON THE HEAD AND USED FOR FITNESS APPLICATIONS.
The LifeBEAM Hat is an activity monitor in a hat form factor. This wearable device uses aerospace grade optical heart rate measurement,...

FREE WAVZ

WORN ON THE EAR AND USED FOR FITNESS APPLICATIONS.
The Free Wavz is an earphone designed for fitness enthusiasts. This wearable device supports fitness monitoring, and can connect with phone...

MOTO 360

WORN ON THE WRIST AND USED FOR LIFESTYLE APPLICATIONS.
The Moto 360 is a smartwatch that communicates with a tethered phone to deliver notifications and act as an interface with the phone. This...

SAMSUNG GEAR S

WORN ON THE WRIST AND USED FOR LIFESTYLE & FITNESS APPLICATIONS.
The Samsung Gear S is a standalone smartwatch that does not require tethering for full functionality. This wearable device features a...

SPROUTLING BABY MONITOR

WORN ON THE ANKLE AND USED FOR LIFESTYLE & MEDICAL APPLICATIONS.
The Sproutling Baby Monitor is a wearable device designed for infants from 0 to 18 months old. This technology is used to sense an infant's...

SYNC FITNESS BANDS

WORN ON THE WRIST AND USED FOR FITNESS APPLICATIONS.
The Sync Fitness Band is a smart watch that can track the distance traveled, step counts and heart rate of the user. This technology has...

MIO LINK

WORN ON THE WRIST AND USED FOR FITNESS APPLICATIONS.
The Mio Link sports watch is a wearable device that continuously measures the heart rate of the user. This technology has wireless...

TOMTOM RUNNER CARDIO

WORN ON THE WRIST AND USED FOR LIFESTYLE APPLICATIONS.
The TomTom Runner is a wearable device that has a built in heart rate monitor. It can also measure fitness data such as step count,...

HXM SMART

WORN ON THE CHEST AND USED FOR FITNESS APPLICATIONS.
HXM Smart is a wearable activity-monitoring device that is compatible with Android and iOS devices. This system is worn on the chest and...

SENTIMOTO

WORN ON THE WRIST AND USED FOR FITNESS & MEDICAL APPLICATIONS.
Sentimoto is a smart wearable watch that captures the users' physiological and environmental data, in order to determine their overall...

BSX INSIGHT

WORN ON THE LEGS AND USED FOR FITNESS & LIFESTYLE APPLICATIONS.
The BSX Insight is a wearable sensor that can be paired to a sports smartwatch or smartphone in order to record heart rate, lactate...

BIOHARNESS 3

WORN ON THE TORSO AND USED FOR FITNESS APPLICATIONS.
Bioharness 3 is a wearable activity monitor that analyses the user's movements and provides performance analysis, which can be displayed on...

INSTABEAT

WORN ON THE HEAD AND USED FOR FITNESS APPLICATIONS.
The Instabeat is a waterproof heart rate monitor mounted on a pair of swimming goggles, which provides real-time visual feedback. This...

ATHOS

WORN ON THE TORSOLEGS & THIGHS AND USED FOR FITNESS APPLICATIONS.
Athos is a hi-tech wearable technology apparel which measures fitness data such as muscle effort, heart rate, balance and reps. This...

AQUAPULSE HEART RATE MONITOR

WORN ON THE EAR AND USED FOR FITNESS & MEDICAL APPLICATIONS.
AquaPulse is a heart rate monitor designed by Finis for swimmers to keep track of their heart rate while swimming. This wearable device can...

SAMSUNG GEAR FIT

WORN ON THE WRIST AND USED FOR LIFESTYLE & FITNESS APPLICATIONS.
The Samsung Gear Fit is a smart watch that allows the user to pick up calls, view fitness data and personalize themes. This wearable device...

OMSIGNAL

WORN ON THE TORSO AND USED FOR FITNESSMEDICAL & LIFESTYLE APPLICATIONS.
The OMsignal is a high-performance sports wear that records heart rate and other vital data for fitness and everyday use. The wearable...

VOYCE DOG MONITOR

WORN ON THE NECK AND USED FOR PETS ANIMALS APPLICATIONS.
The Voyce Dog monitor is a wearable device for dogs that measures key vital signs and overall health. The hi-tech monitor can measure heart...

SAMSUNG GEAR 2 NEO

WORN ON THE WRIST AND USED FOR LIFESTYLE & FITNESS APPLICATIONS.
The Samsung Gear 2 Neo is the second generation of the Samsung Gear which is a wearable device that has multiple functions such as...


Posted by 쁘레드
재밌는세상2015. 3. 17. 06:27

오늘은 이것도 안되네.. 니미 미네랄~

-----------------

한국의 인터넷뱅킹 참 그지같지요. 10년이상 같은 문제가 고쳐지지 않는것을 보면 한국이 IT강국이라는 말은 이미 무색해진듯. 인터넷 뱅킹 전용 노트북도 가져보고. 참 별짓을 다 해봤지만 그남아 쬐끔 편한 방법은 (우리은행의 경우)


여기 접속해서 5개 프로그램 다 설치하고 다시 try하면 좀 나은 결과가 나오더군요. 

https://spib.wooribank.com/pib/Dream?withyou=CMCOM0127&VP=install&orgUrl=https%3A%2F%2Fspib.wooribank.com%2Fpib%2FDream%3Fwithyou%3DPSINQ0013&url=https%3A%2F%2Fspib.wooribank.com%2Fpib%2FDream%3Fwithyou%3DCMCOM0127%26P_name%3DIPinside%26url%3Dhttps%253A%252F%252Fspib.wooribank.com%252Fpib%252FDream%253Fwithyou%253DPSINQ0013


그남아도 영문 OS에서 Region And Language에서 Locale이 한국/한국어로 안되어 있으면 안됨.


한국 인터넷 뱅킹 지랄맛은 것은 한두줄 설명으로 끝낼수 없단. 생각만 해도 짜증나는, 그렇다고 안전한것도 아니고, 털릴것은 다 털리고 사용자에게는 짜증만 주고... 더 이상 설명은 분노가 치밀어 올라 여기서 줄인다.


Posted by 쁘레드
경제이야기/Stock2015. 3. 17. 05:46

GM이 미리 중국에 진출에서 좋은 성과를 낸것은 잘한것 같다. Ford도 최근에 높은 성장률을 보이고 있으니 이것도 다행이고. 둘 비교는 의미가 크다.

이번년 중국의 성장률이 7%도 어려울듯 한데, 자동차 산업은 어떨지 또 궁금. 내수를 살릴 생각이면 중국내 자동차 판매에 도움이 되겠지만, 공해문제 해소에 초점을 마추면 자동차 판매는 쉽지 않을것 같고.


------------------------

How Ford And GM Compare In China

Summary

  • Ford is behind GM in China, although recent sales figures seem to favor the former.
  • In absolute numbers, GM remains ahead of Ford and gives it a big advantage.
  • GM shouldn't take its current position for granted because things can always change.

Ford (NYSE:F) and GM (NYSE:GM) are the two most prominent car manufacturers from the United States. Throughout their long history together, they have competed with one another and the two can be considered rivals. Neither of the two companies has a clear advantage over the other to be number one in the United States. They go back and forth as time goes by.

With that said, it can be argued that Ford has been the better of the two in recent years. For instance, while GM needed a massive government bailout to recover from bankruptcy at the height of the Financial Crisis in 2008/2009, Ford did much better and was able to keep its problems more or less under control.

However, the one consistent and constant advantage that GM has had over Ford is in the Chinese market. In China, GM is way ahead of Ford by a huge margin. Some of GM's brands such as Buick are doing very well there, even though they may be struggling elsewhere. That helps illustrate the level of success GM has managed to achieve in China.

The trend in China may be changing in favor of Ford

GMUnit Sales% Change (Y/Y)
January 2015339,781-2.4
February 2015261,0721.3

Source: GM releases

FordUnit Sales% Change (Y/Y)
January 2015112,59919
February 201579,3848.7

Source: Ford releases

Recent sales figures from GM and Ford in collaboration with their Chinese partners seem to suggest that this advantage may be slipping. In fact, GMsales in China are actually down in comparison to the previous year. Ford, on the other hand, is doing much better with significant sales increases. Some would therefore argue that Ford is gaining on GM in a market where it has long trailed.

Ford versus GM in China

The latest sales figures come on the heels of other reports which indicate that Ford increased sales last year by over 19 percent in China. GM also did well with a 12 percent increase, but that's substantially below that of Ford. The tables below show the performance of GM and Ford over the last several years.

Furthermore, Ford has beaten GM for the last three years using this metric. You would have to go all the way back to 2011 for the last time that GM was able to post a higher number than Ford. It would seem that a pattern is beginning to appear.

GMUnit SalesUnit Increase% Increase
20091,826,424  
20102,351,610525,18628.8
20112,547,171195,5618.3
20122,836,128288,95711.3
20133,160,377324,24911.4
20143,539,970379,59312.0
FordUnit SalesUnit Increase% Increase
2009440,619  
2010483,28842,6699.6
2011519,39036,1027.4
2012626,616107,22620.6
2013935,812309,19649.3
20141,114,669178,85719.1

The market in China continues to grow

With China now being the largest market in terms of vehicles sold, it's important for automakers to do well there as best as they can. No car manufacturer can aspire to be number one globally without also having a strong position in China. Especially not with the Chinese market continuing to grow at a strong clip.

The China Association of Automobile Manufacturers ("CAAM") forecasts sales to grow by around 7 percent in 2015 to 25.1 million vehicles. That continues the steady expansion of the market as seen in recent years. The table below shows the total number of vehicles sold in the preceding years.

 Unit Sales (in millions)% Increase
200913.64 
201018.0632.4
201118.52.4
201219.314.4
201321.9913.9
201423.56.9

Source: CAAM

Is Ford really doing better than GM in China?

It's important to note that while Ford may be posting higher sales figures than GM in terms of percentages, its sales are coming off a much lower base. Therefore, GM sales may seem smaller because the base is so much bigger. Ford's increases in percentages may seem bigger, but they also translate into much smaller increases in absolute terms.

Taking a closer look at the sales statistics shows that while Ford may have increases sales last year by over 19 percent and GM by 12 percent, GM sold 379,593 more vehicles. Ford had 178,857 more vehicles. In other words, GM sales increase in absolute numbers is more than twice that of Ford, even though Ford increased its sales by a higher percentage.

Conclusion

Bottom line, GM is still comfortably ahead of Ford in China despite the progress Ford has made. Even though Ford last year managed to sell more than one million vehicles for the first time in China, GM managed to do that a long time ago and is now at more than 3.5 million vehicles. GM's unit sales are easily over three times that of Ford. China remains a strength of GM.

Granted, GM had a headstart because it entered the Chinese market before Ford did. GM first entered China in the early part of the twentieth century and re-entered the market in the mid nineties. Compared to Ford's greater reluctance, GM placed much stronger emphasis on China than Ford did.

The former is now reaping the benefits of its decision and Ford is forced to play catch up in a market that GM projects could grow to 35 million (passenger and commercial) vehicles by 2020. If this turns out to be accurate, GM will be in an excellent position to take advantage and eclipse the competition.

To Ford's credit, it has managed to make impressive strides even though it's behind. For instance, it has managed to beat Japanese manufacturers such as Toyota (NYSE:TM) and has now surpassed them in sales. The key is to keep up the effort and it's possible that for Ford the best is yet to come.

With all that said, GM should not become complacent even if it doesn't have to worry too much about Ford. Frequent recalls like you have now and other technical defects don't exactly help your reputation when you're selling a product.

GM therefore shouldn't take its current position for granted. It would not be the first time that an automaker lost its leading position. After all, just because you're ahead in the race doesn't mean you've also won the race. The race is far from over.


Posted by 쁘레드
경제이야기/Stock2015. 3. 17. 05:42

AA stock price가 aluminum가격과 100% 싱크를 보여왔지만, 이제는 아니다는 내용인듯. 이미 AA의 매출 기여도에 AA는 50%밖에 안되는데. 다음에 다시 정리.


------------------------

Summary

  • For the last 5+ years, shares of Alcoa have, for the most part, tracked the LME aluminum spot price.
  • A change in internal investment strategy could be freeing the company from the clutches of the commodity.
  • After three acquisitions, Alcoa can produce almost every part required in a metallic airplane.
  • The recent acquisitions have also beefed up Alcoa's exposure to titanium at a crucial time.

For as long as I have been trading stocks, there has been one thing drilled into my head over and over again when it comes to companies in the commodity business: their stock almost always trades with the commodity itself. Whether it be gold, copper, natural gas, oil, or any other commodity, this rule always holds true. Don't believe me? Just check any oil stock's performance since the price of the liquid began its decent in late November.

The thought behind this principle is so simple that even the most inexperienced of investors should be able to understand. When companies produce a commodity and the price of that commodity is high, revenue is equally high, margins expand and earnings rise. On the other hand, when the value of the underlying commodity falls, revenue dips, but costs remain the same. Therefore, margins contract (maybe even turn negative) and earnings decline sharply. In each case, the stock trades accordingly, as can be seen in the 5-year chart of the aluminum producer, Alcoa (NYSE:AA), presented below.
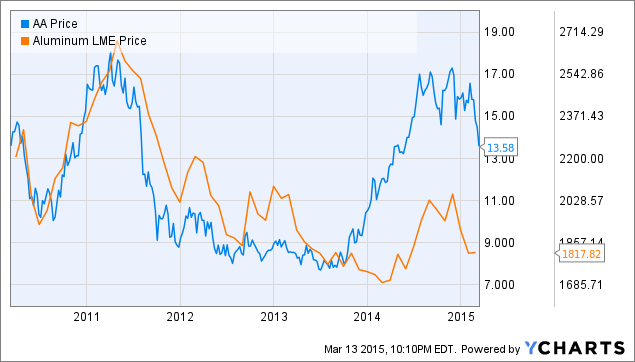
AA Chart

AA data by YCharts

So, what can a company do to break this lockstep correlation from occurring? The company must fundamentally change its business. And that is exactly what Alcoa has been doing ever since Klaus Kleinfeld took the helm in 2008, divesting high cost production capacity and investing in new value-adding technologies through both internal development and external acquisitions.

When Kleinfeld took over, Alcoa was coming off one of the strongest years of financial performance in memory. Revenue reached a record $30.7 billion and EPS was reported at $2.95. Now, just as Alcoa appears to be returning to form, recently reporting what were undoubtedly the strongest yearly financial results at the company since 2007/2008 that generated earnings of $.92 per share on $23.9 billion in revenue, some are beginning to call a top. Some of the bearish theses include an oversupply of aluminum or a slowdown in aluminum demand. Both of which are health concerns. However, investors must realize that this Alcoa is not the company that saw its shares decline some 80 plus percent in 2008.

For starters, the old Alcoa was investing heavily in expanding the company's production capacity. Read the following excerpts from the 2007 annual report:

We invested in new plants, expanded production at others, modernized operations, renegotiated long-term power agreements, and built new energy facilities to extend our energy access at competitive rates, while also continuing to invest in growth markets such as Brazil, China, and Russia.

In total, our capital investments were approximately $3.16 billion in 2007 (excluding currency impacts) with nearly 60 percent, or $1.7 billion, dedicated to growth projects.

The "growth projects" talked about referenced the construction of two smelters in Iceland and Norway, while much of the rest of the capital budget was spent on various energy producing projects and other, smaller capacity building initiatives. Each of these investments caused the company to become more levered to commodity pricing. Thus, when the LME price sank in 2008, you better believe the stock followed.

By contrast, the new Alcoa has targeted its investing activities on the downstream, value-added side of the business, while divesting high cost capacity to lower its positions on both the alumina and aluminum cost curves.

Above is a graphical representation of Alcoa's positioning on the aluminumcost curve. As you can see, the company has successfully reduced its positioning by 8% points over the last four years through the closing of high cost capacity, something that was not occurring at the peak in 2008. The same holds true for the company's position on the alumina cost curve shown below.

The change here has been a bit more modest, declining only 5% pts over the four-year span. However, in both cases, Alcoa is improving its positioning, thus protecting itself from the volatile swings that can be seen in the commodity market by shutting down high cost capacity. Since the peak in 2007, the company has closed, curtailed, or sold roughly 31% of its highest cost smelting capacity. And Alcoa appears poised to expand upon these efforts in 2015, announcing the review of 500 metric tons (14%) of smelting capacity and 2.8 million metric tons (16%) of refining capacity for curtailment or divestiture.

Moving to the perhaps more exciting side of the portfolio transformation, Alcoa has begun to differentiate its products for more sustainable end markets such as aerospace and automotive. In aerospace, the strides made have been phenomenal, adding Firth Rixon, Tital, and RTI International to its portfolio in the past 6 months or so. Each of which, has allowed Alcoa to expand its presence in the aircraft. Just look at the graphic below.

Alcoa now has the ability to produce nearly every part of the metallic-intensive aircrafts assembled and sold by the likes of Boeing (NYSE:BA) and Airbus. These differentiated products are much less likely to be exposed to the same commodity-based pricing scrutiny as the basic aluminum or alumina that was being produced back in 2007.

The acquisitions of these three companies also makes Alcoa one of, if not, the top producers of titanium domestically. This shift could not have come at a better time, as Russian sanctions are currently threatening the titanium imports that U.S. industries, as well as the defense sector, so heavily rely on.

Final Thoughts

Summing it all up, Klaus Kleinfeld is truly transforming Alcoa as we know it, attempting to break both the company and the stock free from their cyclical ties to the commodity price of aluminum. And, I believe he is doing an excellent job of it, targeting the company's investment spending on value-enhancing, downstream initiatives instead of on the expansion of high cost capacity that was seen in 2007. Though the prices paid for these acquisitions do include a fairly sizeable premium, the investments are justified from my standpoint and the stock should come to reflect that soon enough.


Posted by 쁘레드
경제이야기/Stock2015. 3. 17. 05:41

Ford가 undervalue되어있어 130% 더 오를수 있다는 얘기. Stock Buy back을 더 해줘야 한다는데... 흐뭇해지는 얘기지만 현실성은 좀 부족하네요. 이친구는 어떤게 계산하는지 따라해봐야겠네요.


----------------------

Long/short equity, special situations
Profile| Send Message| 
 ( followers)  

Summary

  • Ford Motor is substantially undervalued on a free cash flow basis.
  • I calculate an intrinsic value of $37 based on Ford Motor's free cash flow to equity and based on moderate growth assumptions.
  • Ford should follow General Motors' lead and announce a voluminous stock buyback.
  • Ford Motor's shares have more than 130% upside potential.

Ford Motor (NYSE:F) is one of the most undervalued companies in the stock market right now. Ford Motor does not only offer a solid dividend yield of 3.70%, but also substantial capital appreciation potential. In order to calculate Ford Motor's intrinsic value, I have derived Ford Motor's free cash flow to equity, a measure that shows how much cash is available for return to shareholders. The free cash flow to equity includes debt cash flows, debt proceeds and repayments, which are easily pulled from the firm's 10-K filing with the SEC.

General Motors (NYSE:GM) recently announced a major share buyback program, about which I wrote here. Share buybacks are financed out of a company's free cash flow to equity, which is why I use this measure to calculate Ford's indicative fair value.

Intrinsic value estimate

The table below contains Ford Motor's operating-, core investing- (capital expenditures, no inclusion of finance receivables, operating leases and sales/purchases of marketable securities) and debt cash flows from Ford Motor's cash flow statements for the years 2012-2014 (Source: Recent Ford Motor 10-K SEC filing). The table also includes my cash flow estimates for 2015.

The free cash flow to equity sums up operating, investment and debt-related cash flows. The resulting free cash flow to equity depicts the amount of cash that can be distributed to shareholders in the form of dividends and share buybacks.

I estimate that Ford Motor will be able to rake in $10.3 billion in free cash flow to equity in 2015, part of which is driven by positive net borrowings. On a per share basis, I estimate that Ford Motor can earn approximately $2.55 in FCFE in 2015, which translates into a P/FCFE ratio of just 6.4x. In other words, given the assumptions outlined below, Ford Motor's share price currently implies a near 16% FCFE yield.

(click to enlarge)

Source: Achilles Research, Company Financials

Using the derived free cash flow to equity per share as the basis for a discounted cash flow valuation model leads to the conclusion that Ford Motor is substantially undervalued.

Assuming moderate free cash flow to equity growth rates of about 3% in the short- and long-term, and applying an equity cost of capital rate of 10%, a two-stage FCFE valuation model leads to an intrinsic value of $37 per Ford share.

(click to enlarge)Source: Achilles Research, Company Financials

This high a value is not necessarily astonishing, because both operating cash flows and net borrowings are key drivers of the FCFE. Further, Ford Motor has had great success in growing operating cash flow: In the last year alone, Ford grew cash flow from operating activities by 39%.

Ford's high free cash flows lead to an intrinsic value that is way above its current share price of $16. Consequently, I think Ford Motor should follow General Motors lead here and announce a $10 billion share buyback to make better use of its cash. Ford can surely afford it.

Your Takeaway

Not everybody has to agree with the use of a FCFE valuation model for an auto manufacturer or with the growth assumptions embedded in such model. The derived value is an indicative fair value only.

However, the model goes to show that Ford Motor is substantially undervalued on a free cash flow to equity basis and that the company has a lot of resources available to fund stock buybacks.

Last but not least, Ford's free cash flow strength provides investors with a very wide margin of safety. Strong Buy.


'경제이야기 > Stock' 카테고리의 다른 글

F How Ford And GM Compare In China  (0) 2015.03.17
AA This Is Not The Same Alcoa  (0) 2015.03.17
20150315 아주 관심있는 종목 리스트  (0) 2015.03.16
Kiplinger's 2015 Feb - Future stock 추천  (0) 2015.03.15
유럽동향 2015/03/12  (0) 2015.03.13
Posted by 쁘레드

기본족으로 간통죄는 있어야 하지 않나 하는 입장이었는데 방송을 잘 들어보니 간통죄는 없어지고 오히려 이혼소송에서 귀책사유가 있는 사람에게 더 많은 책임을 물리는게 낫다는 생각이 들더군요.

간통죄 폐지이후

  1. 콘돔 회사 주가가 폭등하고
  2. 나이트 클럽 손님들이 더 많이 몰리고
  3. 등산복 회사들이 수요가 더 많아질것을 예상하고

뭘 잘 모르는 사람들인지, 아니면 우리나라 사법 시스템을 우숩게 아는건지...

하여간 간만에 젤 재밌는 방송이었던것 같습니다. 19금.


http://www.podbbang.com/ch/4362


Posted by 쁘레드