경제이야기/Stock2015. 3. 17. 05:42

AA stock price가 aluminum가격과 100% 싱크를 보여왔지만, 이제는 아니다는 내용인듯. 이미 AA의 매출 기여도에 AA는 50%밖에 안되는데. 다음에 다시 정리.


------------------------

Summary

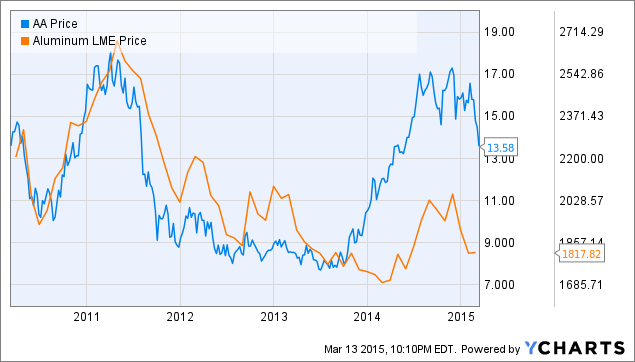
  • For the last 5+ years, shares of Alcoa have, for the most part, tracked the LME aluminum spot price.
  • A change in internal investment strategy could be freeing the company from the clutches of the commodity.
  • After three acquisitions, Alcoa can produce almost every part required in a metallic airplane.
  • The recent acquisitions have also beefed up Alcoa's exposure to titanium at a crucial time.

For as long as I have been trading stocks, there has been one thing drilled into my head over and over again when it comes to companies in the commodity business: their stock almost always trades with the commodity itself. Whether it be gold, copper, natural gas, oil, or any other commodity, this rule always holds true. Don't believe me? Just check any oil stock's performance since the price of the liquid began its decent in late November.

The thought behind this principle is so simple that even the most inexperienced of investors should be able to understand. When companies produce a commodity and the price of that commodity is high, revenue is equally high, margins expand and earnings rise. On the other hand, when the value of the underlying commodity falls, revenue dips, but costs remain the same. Therefore, margins contract (maybe even turn negative) and earnings decline sharply. In each case, the stock trades accordingly, as can be seen in the 5-year chart of the aluminum producer, Alcoa (NYSE:AA), presented below.
AA Chart

AA data by YCharts

So, what can a company do to break this lockstep correlation from occurring? The company must fundamentally change its business. And that is exactly what Alcoa has been doing ever since Klaus Kleinfeld took the helm in 2008, divesting high cost production capacity and investing in new value-adding technologies through both internal development and external acquisitions.

When Kleinfeld took over, Alcoa was coming off one of the strongest years of financial performance in memory. Revenue reached a record $30.7 billion and EPS was reported at $2.95. Now, just as Alcoa appears to be returning to form, recently reporting what were undoubtedly the strongest yearly financial results at the company since 2007/2008 that generated earnings of $.92 per share on $23.9 billion in revenue, some are beginning to call a top. Some of the bearish theses include an oversupply of aluminum or a slowdown in aluminum demand. Both of which are health concerns. However, investors must realize that this Alcoa is not the company that saw its shares decline some 80 plus percent in 2008.

For starters, the old Alcoa was investing heavily in expanding the company's production capacity. Read the following excerpts from the 2007 annual report:

We invested in new plants, expanded production at others, modernized operations, renegotiated long-term power agreements, and built new energy facilities to extend our energy access at competitive rates, while also continuing to invest in growth markets such as Brazil, China, and Russia.

In total, our capital investments were approximately $3.16 billion in 2007 (excluding currency impacts) with nearly 60 percent, or $1.7 billion, dedicated to growth projects.

The "growth projects" talked about referenced the construction of two smelters in Iceland and Norway, while much of the rest of the capital budget was spent on various energy producing projects and other, smaller capacity building initiatives. Each of these investments caused the company to become more levered to commodity pricing. Thus, when the LME price sank in 2008, you better believe the stock followed.

By contrast, the new Alcoa has targeted its investing activities on the downstream, value-added side of the business, while divesting high cost capacity to lower its positions on both the alumina and aluminum cost curves.

Above is a graphical representation of Alcoa's positioning on the aluminumcost curve. As you can see, the company has successfully reduced its positioning by 8% points over the last four years through the closing of high cost capacity, something that was not occurring at the peak in 2008. The same holds true for the company's position on the alumina cost curve shown below.

The change here has been a bit more modest, declining only 5% pts over the four-year span. However, in both cases, Alcoa is improving its positioning, thus protecting itself from the volatile swings that can be seen in the commodity market by shutting down high cost capacity. Since the peak in 2007, the company has closed, curtailed, or sold roughly 31% of its highest cost smelting capacity. And Alcoa appears poised to expand upon these efforts in 2015, announcing the review of 500 metric tons (14%) of smelting capacity and 2.8 million metric tons (16%) of refining capacity for curtailment or divestiture.

Moving to the perhaps more exciting side of the portfolio transformation, Alcoa has begun to differentiate its products for more sustainable end markets such as aerospace and automotive. In aerospace, the strides made have been phenomenal, adding Firth Rixon, Tital, and RTI International to its portfolio in the past 6 months or so. Each of which, has allowed Alcoa to expand its presence in the aircraft. Just look at the graphic below.

Alcoa now has the ability to produce nearly every part of the metallic-intensive aircrafts assembled and sold by the likes of Boeing (NYSE:BA) and Airbus. These differentiated products are much less likely to be exposed to the same commodity-based pricing scrutiny as the basic aluminum or alumina that was being produced back in 2007.

The acquisitions of these three companies also makes Alcoa one of, if not, the top producers of titanium domestically. This shift could not have come at a better time, as Russian sanctions are currently threatening the titanium imports that U.S. industries, as well as the defense sector, so heavily rely on.

Final Thoughts

Summing it all up, Klaus Kleinfeld is truly transforming Alcoa as we know it, attempting to break both the company and the stock free from their cyclical ties to the commodity price of aluminum. And, I believe he is doing an excellent job of it, targeting the company's investment spending on value-enhancing, downstream initiatives instead of on the expansion of high cost capacity that was seen in 2007. Though the prices paid for these acquisitions do include a fairly sizeable premium, the investments are justified from my standpoint and the stock should come to reflect that soon enough.


Posted by 쁘레드
경제이야기/Stock2015. 3. 17. 05:41

Ford가 undervalue되어있어 130% 더 오를수 있다는 얘기. Stock Buy back을 더 해줘야 한다는데... 흐뭇해지는 얘기지만 현실성은 좀 부족하네요. 이친구는 어떤게 계산하는지 따라해봐야겠네요.


----------------------

Long/short equity, special situations
Profile| Send Message| 
 ( followers)  

Summary

  • Ford Motor is substantially undervalued on a free cash flow basis.
  • I calculate an intrinsic value of $37 based on Ford Motor's free cash flow to equity and based on moderate growth assumptions.
  • Ford should follow General Motors' lead and announce a voluminous stock buyback.
  • Ford Motor's shares have more than 130% upside potential.

Ford Motor (NYSE:F) is one of the most undervalued companies in the stock market right now. Ford Motor does not only offer a solid dividend yield of 3.70%, but also substantial capital appreciation potential. In order to calculate Ford Motor's intrinsic value, I have derived Ford Motor's free cash flow to equity, a measure that shows how much cash is available for return to shareholders. The free cash flow to equity includes debt cash flows, debt proceeds and repayments, which are easily pulled from the firm's 10-K filing with the SEC.

General Motors (NYSE:GM) recently announced a major share buyback program, about which I wrote here. Share buybacks are financed out of a company's free cash flow to equity, which is why I use this measure to calculate Ford's indicative fair value.

Intrinsic value estimate

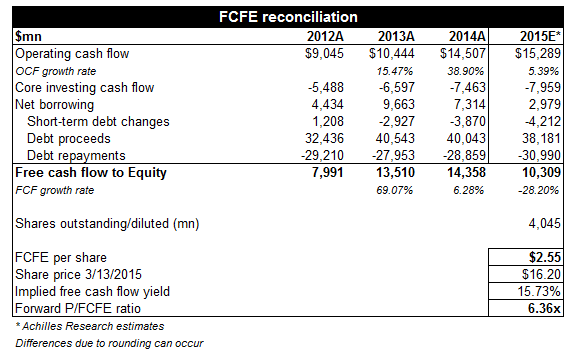
The table below contains Ford Motor's operating-, core investing- (capital expenditures, no inclusion of finance receivables, operating leases and sales/purchases of marketable securities) and debt cash flows from Ford Motor's cash flow statements for the years 2012-2014 (Source: Recent Ford Motor 10-K SEC filing). The table also includes my cash flow estimates for 2015.

The free cash flow to equity sums up operating, investment and debt-related cash flows. The resulting free cash flow to equity depicts the amount of cash that can be distributed to shareholders in the form of dividends and share buybacks.

I estimate that Ford Motor will be able to rake in $10.3 billion in free cash flow to equity in 2015, part of which is driven by positive net borrowings. On a per share basis, I estimate that Ford Motor can earn approximately $2.55 in FCFE in 2015, which translates into a P/FCFE ratio of just 6.4x. In other words, given the assumptions outlined below, Ford Motor's share price currently implies a near 16% FCFE yield.

(click to enlarge)

Source: Achilles Research, Company Financials
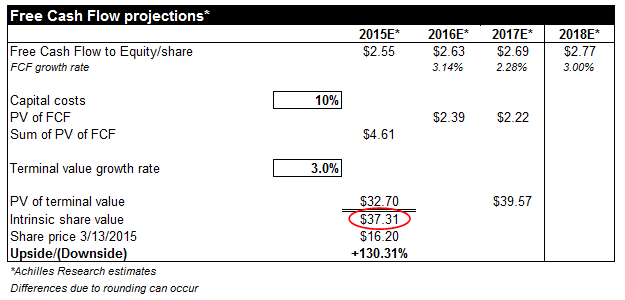
Using the derived free cash flow to equity per share as the basis for a discounted cash flow valuation model leads to the conclusion that Ford Motor is substantially undervalued.

Assuming moderate free cash flow to equity growth rates of about 3% in the short- and long-term, and applying an equity cost of capital rate of 10%, a two-stage FCFE valuation model leads to an intrinsic value of $37 per Ford share.

(click to enlarge)Source: Achilles Research, Company Financials

This high a value is not necessarily astonishing, because both operating cash flows and net borrowings are key drivers of the FCFE. Further, Ford Motor has had great success in growing operating cash flow: In the last year alone, Ford grew cash flow from operating activities by 39%.

Ford's high free cash flows lead to an intrinsic value that is way above its current share price of $16. Consequently, I think Ford Motor should follow General Motors lead here and announce a $10 billion share buyback to make better use of its cash. Ford can surely afford it.

Your Takeaway

Not everybody has to agree with the use of a FCFE valuation model for an auto manufacturer or with the growth assumptions embedded in such model. The derived value is an indicative fair value only.

However, the model goes to show that Ford Motor is substantially undervalued on a free cash flow to equity basis and that the company has a lot of resources available to fund stock buybacks.

Last but not least, Ford's free cash flow strength provides investors with a very wide margin of safety. Strong Buy.


'경제이야기 > Stock' 카테고리의 다른 글

F How Ford And GM Compare In China  (0) 2015.03.17
AA This Is Not The Same Alcoa  (0) 2015.03.17
20150315 아주 관심있는 종목 리스트  (0) 2015.03.16
Kiplinger's 2015 Feb - Future stock 추천  (0) 2015.03.15
유럽동향 2015/03/12  (0) 2015.03.13
Posted by 쁘레드
경제이야기/Stock2015. 3. 16. 09:47

년초에 1년목표 수익률을 다 달성해 놓는것이 어깨에 힘빼고 치기에 좋은데, 이번년은 벌써 3월인데 녹녹치 않네요.

NXP Semiconductors는 작년말에 들어갔어야 했는데, 다른데 정신이 팔려있어서 좋은 보석을 놓쳤네요. 추가 상승여지가 얼마나 있는지 잘 생각해봐야 하겠네요.


NameSymbolLast priceMkt capVolumeAvg vol52wk high52wk lowEPSP/EBetaEBITDA Cur Ratio
QUALCOMM, Inc.QCOM68.64113.23B13.95M13.65M81.9762.264.7314.511.229.38B3.55
Apple Inc.AAPL123.59719.88B51.83M59.79M133.673.04717.4216.650.8767.66B1.13
Intel CorporationINTC30.93146.48B47.95M30.43M37.924.42.3213.320.9524.19B1.73
Delta Air Lines, Inc.DAL45.537.50B10.04M12.42M51.0630.120.7659.80.826.91B0.74
Tesla Motors IncTSLA188.6823.73B5.43M5.49M291.42177.22-2.35n/a0.645.24M1.48
Ford Motor CompanyF16.264.09B27.88M27.14M18.1213.260.7920.441.5311.21B1.74
Nuance Communications...NUAN13.874.51B1.50M2.18M19.6113.2-0.46n/a1.14186.74M1.92
Goodyear Tire & Rubber...GT25.246.80B2.33M3.52M28.9818.878.842.852.092.25B1.63
Alcoa IncAA13.5716.59B16.91M22.39M17.7511.610.266.751.583.561.48
eBay IncEBAY59.0771.48B7.87M8.06M60.9346.340.051,144.550.915.04B1.51
Yahoo! Inc.YHOO42.8740.13B9.09M14.61M52.6232.157.455.751.11682.48M2.14
Alibaba Group Holding...BABA81.86203.61B12.66M15.84M12080.031.845.494.74B2.7
Semicond. Manufacturing...SMI4.33.09B31,041.0073,249.005.483.740.1922.111.43671.27M1.58
NXP Semiconductors NVNXPI104.6726.35B8.27M4.05M105.1253.812.1748.192.751.47B2
Palo Alto Networks IncPANW141.3411.63B958,853.001.48M149.349957.4712-3.28n/a-76.94M2.08
iRobot CorporationIRBT33.01979.48M623,229.00583,000.0045.0928.051.2526.361.7465.37M3.79
Petroleo Brasileiro...PBR5.0133.48B56.84M45.56M20.944.90.935.381.8822.17B1.7
Hanwha Q Cells Co LtdHQCL1.11110.50M556,940.00352,504.003.970.92-1.24n/a2.8759.40M1.85


'경제이야기 > Stock' 카테고리의 다른 글

AA This Is Not The Same Alcoa  (0) 2015.03.17
F Ford Motor Could Be Worth Up To $37 Per Share  (0) 2015.03.17
Kiplinger's 2015 Feb - Future stock 추천  (0) 2015.03.15
유럽동향 2015/03/12  (0) 2015.03.13
20150308 BioTech 추천주  (0) 2015.03.09
Posted by 쁘레드
경제이야기/Stock2015. 3. 15. 15:28

좋은 주제의 글인듯.

Illumina, IRobot, NXP Semiconductors, Palo Alto Networks는 관심종목으로 track해봐야 할듯.

ATHN,CGNX,FEYE,ILMN,IRBT,LOCK,MBLY,NVDA,NXPI,PANW,SLAB,SWKS,SPLK


Posted by 쁘레드
경제이야기/Stock2015. 3. 13. 13:03

ECB양정완화에 따라 어디다 한번 묻어볼까 생각중.

그리스는 조용히 다시 위기로 가고 있는것 같고, 안탁깝게도 아무도 지켜봐주지 않고 있네요. 좀있으면 다시 부각되겠지?

엄청난 유로화 약세에 따라 독일을 중심으로 수출기업들은 주가가 날라다니고 있슴.(좋겠다)


Name▲SymbolLast priceMkt capVolumeAvg vol52wk high52wk lowEPSP/EBetaBeta(y)Cur Ratio
Dow Jones Greece Total...DWGCNDT566.7101350.38536.06
National Bank of Greece...NBG1.224.20B5.62M22.34M5.830.98-0.422.49
Vanguard FTSE Europe ETFVGK53.7912.21B1.17M61.8949.81-3.671.32
T. Rowe Price European...PRESX20.42
AIRBUS GROUP N.V.AIR62.0155,255.0062.4639.686
Bayerische Motoren...BMW118.5576.35B20,212.00119.8574.9€8.8813.34
Daimler AGDAI92.798.91B57,691.0093.11555.21€6.5114.24
Volkswagen AGVOW237.7113.99B2,391.00239148.775€22.0010.8
STMicroelectronics NV...STM9.168.69B1.90M2.47M106.270.1563.151.49


사상 최고의 초강세 달러화. 결국 미국 경제에는 부메랑이 되어 돌아올것이 때문에 쉬어안갈수 없을테고 연준은 쉽게 금리를 못올리게 될것 같음.

1년내 30-40%떨어진 유로화로 저렴해진 유럽여행이나 한번 다녀와야 할듯.


Markets at a Glance

Major Stock Indexes

12:28 AM EDT 3/13/2015
LASTCHANGE% CHG
DJIA17895.22259.831.47%
Nasdaq4893.2943.350.89%
S&P 5002065.9525.711.26%
Russell 20001236.6420.861.72%
Global Dow2506.680.680.03%
Japan: Nikkei 22519255.09263.981.39%
Stoxx Europe 600395.36-0.12-0.03%
UK: FTSE 1006761.0739.560.59%

DJIA

4:33 PM EDT 3/12/2015

18000
17900
17800
17700
17600
10a
11a
12p
1p
2p
3p
  • 1D
  • 5D
  • 3M
  • 6M
  • 1Y
  • 3Y

Currencies

12:27 AM EDT 3/13/2015
LAST(MID)CHANGE
Euro (EUR/USD)1.0612-0.0025
Yen (USD/JPY)121.480.19
Pound (GBP/USD)1.4867-0.0017
Australia $ (AUD/USD)0.7677-0.0030
Swiss Franc (USD/CHF)1.00430.0022
WSJ Dollar Index88.750.17

Futures

12:18 AM EDT 3/13/2015
LASTCHANGE% CHG
Crude Oil47.100.050.11%
Brent Crude57.420.140.24%
Gold1157.96.00.52%
Silver15.6050.0890.57%
E-mini DJIA17877110.06%
E-mini S&P 5002065.751.750.08%

Government Bonds

12:27 AM EDT 3/13/2015
PRICE CHGYIELD
U.S. 10 Year-1/322.123
German 10 Year0/320.213
Japan 10 Year-8/320.403


Posted by 쁘레드
경제이야기/Stock2015. 3. 9. 10:59

세인이 친구아빠로 부터 BioTech투자에 대한 조언을 들었습니다. 요즘 인수합병이 가장 HOT한 분야가 BioTech이지요. 이쪽 이야기는 들어도 잘 몰라서 조언을 필요했는데, 자기가 관심같고 있는 회사와 제 취향에 맞는 회사까지 두루두루 좋은 설명과 함께 좋은 설명을 들었습니다. 좀 조사하고 공부하고 tracking을 해야겠네요.


NameSymbolLast priceChangeMkt capVolumeAvg vol52wk high52wk lowEPSP/EBetaBeta(y)Cur ratio
ISIS Pharmaceuticals...ISIS70.44-1.32 (-1.84%)8.38B3.28M3.03M75.2422.25-0.33na1.531.097.25
Juno Therapeutics IncJUNO52.840.81 (1.56%)4.78B1.27M1.26M61.7034.71-2.24nanana3.25
Regulus Therapeutics IncRGLS20.7-0.43 (-2.04%)1.05B1.14M784,796.0025.605.40-1.27nana1.004.69
Gilead Sciences, Inc.GILD101.81-1.61 (-1.55%)151.64B8.66M12.60M116.8363.507.3713.820.710.833.08
Vertex Pharmaceuticals...VRTX126.34-0.62 (-0.49%)30.59B1.58M1.60M127.6959.79-3.12na0.32-0.704.20
Amgen, Inc.AMGN154.88-4.72 (-2.96%)117.53B4.09M3.53M173.14108.206.7023.120.570.584.95
Illumina, Inc.ILMN193.14-6.99 (-3.49%)27.77B1.10M1.07M213.33127.692.3881.300.800.492.62
Pfizer Inc.PFE33.97-0.50 (-1.45%)208.20B39.92M31.04M34.9727.511.4223.960.740.892.67


Posted by 쁘레드
경제이야기/Stock2015. 3. 9. 10:38


Div Yield Order
Company nameSymbolLast priceMarket capP/E ratioDiv yield (%)52w price change (%)Current ratioCash/shareReturn on assets (5 yr avg) (%)EBITDA margin (%)
Royal Dutch Shell plc (ADR)RDS.A61.04200.97B12.86.16-15.961.166.896.511.44
Telefonica S.A. (ADR)TEF14.7470.44B14.075.94-6.6512.95.5333.11
LUKOIL (ADR)LUKOY46.2638.77B7.545.66-12.11.64.298.8112.27
CNOOC Ltd (ADR)CEO138.9663.02B75.29-14.51.1432.7815.1148.75
ConocoPhillipsCOP62.7977.32B13.624.65-5.421.314.115.7231.4
Verizon Communications Inc.VZ48.29196.65B19.184.561.751.062.685.6428.35
Chevron CorporationCVX103.55194.69B10.224.13-9.841.327.0310.3420.19
Canon Inc (ADR)CAJ33.0744.15B17.424.047.472.66.956.1416.82
BASF SE (ADR)BASFY95.3387.94B15.43.93-15.161.732.058.913.58
Seagate Technology PLCSTX56.918.68B9.433.813.572.418.1318.618.37
Caterpillar Inc.CAT80.0648.53B13.653.5-17.971.3912.115.3715.25
Syngenta AG (ADR)SYT67.0931.48B19.073.48-11.221.723.578.7819.33
Enersis SA (ADR)ENI15.615.53B15.693.4810.721.232.937.1831.39
Siemens AG (ADR)SIEGY107.8590.62B16.513.48-18.521.3113.085.0111.55
SKY PLC (ADR)SKYAY60.1525.94B10.733.33-4.371.025.31617.83
Emerson Electric Co.EMR56.5638.76B17.943.32-13.051.294.529.2220.46
LyondellBasell Industries NVLYB87.441.70B10.933.2-4.022.145.3918.614.84
Merck & Co., Inc.MRK56.84161.32B13.883.17-0.731.775.545.7153.2
China Mobile Ltd. (ADR)CHL64.36267.61B14.113.1634.361.2616.6813.5236.36
CA, Inc.CA31.713.83B18.653.15-4.521.167.417.2736.83
Per Order
Company nameSymbolLast priceMarket capP/E ratioDiv yield (%)52w price change (%)Current ratioCash/shareReturn on assets (5 yr avg) (%)EBITDA margin (%)
CNOOC Ltd (ADR)CEO138.9663.02B75.29-14.51.1432.7815.1148.75
LUKOIL (ADR)LUKOY46.2638.77B7.545.66-12.11.64.298.8112.27
Seagate Technology PLCSTX56.918.68B9.433.813.572.418.1318.618.37
Chevron CorporationCVX103.55194.69B10.224.13-9.841.327.0310.3420.19
SKY PLC (ADR)SKYAY60.1525.94B10.733.33-4.371.025.31617.83
LyondellBasell Industries NVLYB87.441.70B10.933.2-4.022.145.3918.614.84
Royal Dutch Shell plc (ADR)RDS.A61.04200.97B12.86.16-15.961.166.896.511.44
ConocoPhillipsCOP62.7977.32B13.624.65-5.421.314.115.7231.4
Caterpillar Inc.CAT80.0648.53B13.653.5-17.971.3912.115.3715.25
Merck & Co., Inc.MRK56.84161.32B13.883.17-0.731.775.545.7153.2
Telefonica S.A. (ADR)TEF14.7470.44B14.075.94-6.6512.95.5333.11
China Mobile Ltd. (ADR)CHL64.36267.61B14.113.1634.361.2616.6813.5236.36
BASF SE (ADR)BASFY95.3387.94B15.43.93-15.161.732.058.913.58
Enersis SA (ADR)ENI15.615.53B15.693.4810.721.232.937.1831.39
Siemens AG (ADR)SIEGY107.8590.62B16.513.48-18.521.3113.085.0111.55
Canon Inc (ADR)CAJ33.0744.15B17.424.047.472.66.956.1416.82
Lockheed Martin CorporationLMT197.6662.38B17.633.0418.471.114.617.9314.7
Emerson Electric Co.EMR56.5638.76B17.943.32-13.051.294.529.2220.46
CA, Inc.CA31.7113.83B18.653.15-4.521.167.417.2736.83
Baxter International Inc.BAX67.7336.75B19.053.070.241.715.399.625.96
Market Cap Order
Company nameSymbolLast priceMarket capP/E ratioDiv yield (%)52w price change (%)Current ratioCash/shareReturn on assets (5 yr avg) (%)EBITDA margin (%)
China Mobile Ltd. (ADR)CHL64.36267.61B14.113.1634.361.2616.6813.5236.36
Royal Dutch Shell plc (ADR)RDS.A61.04200.97B12.86.16-15.961.166.896.511.44
Verizon Communications Inc.VZ48.29196.65B19.184.561.751.062.685.6428.35
Chevron CorporationCVX103.55194.69B10.224.13-9.841.327.0310.3420.19
Merck & Co., Inc.MRK56.84161.32B13.883.17-0.731.775.545.7153.2
Siemens AG (ADR)SIEGY107.8590.62B16.513.48-18.521.3113.085.0111.55
BASF SE (ADR)BASFY95.3387.94B15.43.93-15.161.732.058.913.58
ConocoPhillipsCOP62.7977.32B13.624.65-5.421.314.115.7231.4
Telefonica S.A. (ADR)TEF14.7470.44B14.075.94-6.6512.95.5333.11
CNOOC Ltd (ADR)CEO138.9663.02B75.29-14.51.1432.7815.1148.75
Lockheed Martin CorporationLMT197.6662.38B17.633.0418.471.114.617.9314.7
Caterpillar Inc.CAT80.0648.53B13.653.5-17.971.3912.115.3715.25
Canon Inc (ADR)CAJ33.0744.15B17.424.047.472.66.956.1416.82
LyondellBasell Industries NVLYB87.441.70B10.933.2-4.022.145.3918.614.84
LUKOIL (ADR)LUKOY46.2638.77B7.545.66-12.11.64.298.8112.27
Emerson Electric Co.EMR56.5638.76B17.943.32-13.051.294.529.2220.46
Baxter International Inc.BAX67.7336.75B19.053.070.241.715.399.625.96
Syngenta AG (ADR)SYT67.0931.48B19.073.48-11.221.723.578.7819.33
SKY PLC (ADR)SKYAY60.1525.94B10.733.33-4.371.025.31617.83
Telekomunikasi Indns (ADR)TLK45.3523.19B19.863.0813.531.163.3816.4252.13


Posted by 쁘레드