경제이야기/Stock2015. 7. 8. 15:39

벌써 내일 어닝발표가 있네요. 회사의 바램과는 다르게 알루미늄가격과 100% 싱크로율을 보여주는 알코아라서 어닝도 좋지않고 그리스나 중국저성장으로 전망도 좋지 못할것 같습니다.

작년에 좋은 수익률을 돌려줘서 좋아하는 주식인데... 년초까지 꿈의 주식이었는데 방향을 획돌렸네요.언제가 될지 모르겠지만 또 살것 같네요. 중국시장이 바닥을 치고 올라올때와 알루미늄 가격을 잘 지켜봐야 할듯.


예상대로 최근에 알루미늄 가격이 더 많이 떨어졌고, 앞으로도 더 떨어질 확률이 높을것 같네요.

-----------------------


Alcoa Inc. Kicks Off Earnings Season: 2 Trades for AA Stock

AA stock bears smell blood in the water, but are they too late to the game?

Alcoa Inc. (AA) will kick off the unofficial start to third-quarter earnings season after the close of trading on Wednesday. The aluminum giant has been pressured this year by a strong U.S. dollar and slowing demand, forcing the company to trim high cost operations, sell low value assets, and focus on lower-cost production.

Despite these moves, AA stock bears smell blood in the water, but are they too late to the game?

By the numbers, Wall Street is looking for fiscal second-quarter earnings of 23 cents per share from Alcoa — up 28% from year-ago levels.  Revenue is seen arriving down 1% at $5.8 billion. However, whispers are swirling that Alcoa will miss earnings targets, with EarningsWhisper.com reporting a whisper number of just 21 cents.

Bearish sentiment has begun to take hold in the analyst community for AA stock. The last several moves within the community have been downgrades, resulting in eight “hold” or worse ratings and 10 “buys,” according to data from Thomson/First Call.  Meanwhile, the 12-month price target currently rests at $16 per share.

Pessimism is also swelling among short sellers. Specifically, the number of AA shares sold short surged by 23% in the most recent reporting period. As a result, some 72.5 million shares of AA stock, or nearly 6% of the stock’s total float, are now sold short.

But, judging from recent options activity, there may be a lack of conviction from the short-selling crowd.  Typically, short sellers will buy short-term call options as a way to hedge their bets, especially ahead of events such as earnings reports.

Along these lines, AA stock’s July/August put/call open interest ratio has fallen to a reading of 0.41, with calls more than doubling puts among options set to expire within the next two months. Taking a closer look at just July options, the put/call open interest ratio falls even further, arriving at 0.38.


 Overall, weekly Jul 10 series implieds are pricing in a potential post-earnings move of about 5% for AA stock. This places the upper bound at $11.54, while the lower bound lies at $10.46.  Historically, implieds seem a bit on the low side, meaning that AA option prices may be low at the moment.

Technically speaking, AA stock is trading deep in short-term oversold territory. The stock is currently perched just above its 2014 lows, which currently correspond with potential support from AA’s 200-week moving average. Despite the overwhelming negativity levied against AA, there is a possibility of a surprise post-earnings rally.

2 Trades for AA Stock

Call Spread: Pessimism toward an underperforming stock is largely par for the course, and AA stock has earned much of its negative reputation on the Street.  However, the recent selloff has placed AA in oversold territory, hinting that the stock’s recent losses may be overdone.  As such, there is the possibility of a snap-back rally for AA following this week’s earnings report, especially if there are any positive nuggets to be gleaned.

As such, traders wanting to take a chance on an AA rally might want to consider a Jul $11/$12 bull call spread.  At last check, this spread was offered at 31 cents, or $31 per pair of contracts. Breakeven lies at $11.31, while a maximum profit of 69 cents, or $69 per pair of contracts, is possible if AA stock closes at or above $12 when July options expire.

Straddle: Alternately, traders with a higher risk tolerance might want to take advantage of this high volatility situation and enter a straddle. A straddle involves the simultaneous purchase of an at-the-money call and an at-the-money put in an attempt to take advantage of a greater than expected move from the underlying stock.

By employing a straddle on AA stock, you are likely betting that the company is going to either handily beat earnings expectations, resulting in a reversal of sentiment and a rush in buying activity, or confirm the Street’s bearish bias, resulting in a flood of sell-on-the-news activity. At last check, the AA Jul 11 straddle was offered at 68 cents, or $68 per pair of contracts. Breakeven for this trade lies at $11.68 on the upside and at $10.32 on the downside.

http://investorplace.com/2015/07/alcoa-inc-kicks-off-earnings-season-2-trades-aa-stock/#.VZzD9DGJugs

---------------------


Aluminum Pricing

Aluminum has diverse applications in industry. It is an important input in the packaging, aerospace, automotive, construction, commercial transportation, power generation, capital goods, and consumer durables industries. Thus, demand for aluminum is broadly correlated with industrial growth. Economic weakness in Europe and slowing Chinese growth have contributed to the weakness in aluminum demand, and consequently prices, over the last few quarters. [1] China, the world’s largest consumer of aluminum, is expected to witness a slowdown in GDP growth to 6.8% and 6.3% in 2015 and 2016, respectively, from 7.4% in 2014. [2]

On the supply side, production capacity has not been reduced corresponding to the weakness in demand over the last few quarters. Persistently high aluminum inventory levels relative to demand have kept LME aluminum prices depressed. This inventory was built up partially as a result of aluminum being tied up in financing deals, which were made possible due to low interest rates. [3] Despite inventories being at a record highs, market forces failed to rationalize supply through the shutdown of smelting capacity. Though global aluminum majors like Alcoa and Rusal did make significant smelting capacity cuts, the same was not true of Chinese companies. This was primarily due to state intervention in the form of provisions of subsidies or renegotiated power contracts to smelters, which serve as a disincentive to cut production. China accounts for around half of the world’s aluminum production, and the expansion in production by Chinese producers has more than made up for capacity cuts by global majors. [4] This oversupply situation is expected to keep aluminum prices depressed.

As a result of the fall in LME prices, regional aluminum prices in China are trading below the costs of production of a majority of Chinese domestic smelters. [5] However, Chinese aluminum producers were boosted by a recent decision of the Chinese government to provide tax breaks and subsidized power to domestic aluminum smelters. [6] In addition, the Chinese government also reduced export taxes on Chinese exports of the metal earlier in the year. [7] A combination of these factors is likely to lead to an increase in Chinese production and exports, which could further worsen the gap between supply and demand, resulting in weak global aluminum prices. This is reflected in the trajectory of London Metal Exchange (LME) aluminum prices so far this year.

LME aluminum prices averaged roughly $1,800 per ton over the course of the second quarter in 2014. These prices averaged close to $1,750 per ton in Q2 2015. [8]  Lower aluminum prices are likely to weigh on the company’s results, particularly those of the Primary Aluminum and Alumina business segments.


http://www.trefis.com/stock/aa/articles/303936/alcoa-q2-earnings-preview-productivity-improvements-to-offset-impact-of-weak-aluminum-pricing/2015-07-06

------------------------

Aluminum Bear Market Piles Pressure on World’s Biggest Smelters

Record Supply

The trend echoes a similar one in steel in the second half of last year, when Chinese exports of excess supplies sent prices tumbling 30 percent. The nation’s aluminum industry quadrupled in the past decade with smelters churning out record amounts of the metal used in everything from packaging to car bumpers.

Aluminum for delivery in three months on the London Metal Exchange fell 1.7 percent on Tuesday to $1,666 a metric ton, entering a bear market. The metal price extended the decline to $1,631.50 on Wednesday. Prices may trade closer to $1,500 a ton by the end of the year, the lowest since 2009, amid record inventories worldwide, according to Colin Hamilton, London-based head of commodities research at Macquarie.

About 20 percent of smelters outside China are losing money at current prices, according to Standard Chartered Plc.

Supply Forecast

Global supplies will exceed demand by 800,000 tons this year, with the surplus tripling from 2014, according to Societe Generale SA. While global aluminum demand is poised to rise by the most among the six main industrial metals, Chinese production is already up 16 percent this year and expected to grow further, according to Macquarie.

Stockpiles of the metal are also easier to obtain after the London Metal Exchange took steps to cut lengthy wait times at its warehouse locations. The backlogs that stretched to almost two years had boosted surcharges added to the exchange benchmark to a record last year, helping producers’ profits.

Moscow-based Rusal, the world’s largest producer, forecasts that China will increase exports of partly processed aluminum by 20 percent, the company said June 25. It will decide whether to cut capacity in the third quarter. Shares of Rusal have dropped 40 percent in Hong Kong trading this year.

http://www.bloomberg.com/news/articles/2015-07-07/aluminum-bear-market-piles-pressure-on-world-s-biggest-smelters

-------------------------

Aluminum Glut Dents Alcoa’s Prospects

Alcoa shareholders should pay close attention to what happens in Beijing.

http://www.wsj.com/articles/aluminum-glut-dents-alcoas-prospects-1436287094

Posted by 쁘레드
경제이야기/Stock2015. 6. 22. 01:56

퀄컴에 대한 Sell과 Buy의 의견이 둘다 있어서 공유합니다. 어느 주식이든 둘다 있을수 밖에 없고 판단은 각자 알아서 하는것이지요. 저는 어느쪽일까요.


팔자에 대한 생각은 인텔과 비교했을때 프리미움이 붙어있다고 보여지는데 이제는 그럴 만한 이유가 없다고 지적합니다. 성장도 못하고 있고 심지어 margin까지급격히 줄고 있습니다. 그리고 4G, 5G로 갈수록 license 비율이 떨어져서 수익이 줄거라 생각하고, 다른 chipset업체와의 경쟁이 치열해 지기때문에 어려울 것이라고 합니다.


사자에 대한 생각은 smartphone 시장이 계속 grow하고 있고, 로얄티 비즈니스가 아주 잘되고 있다. 그리고... 읽어봐도 납득할만한 다른 이유는 못찾겠네요. ^^

--------------------

Why I'm Selling Qualcomm

This Fool has held Qualcomm for over two years, and the mobile chip giant has lagged the broader market for the whole time. Is it time to move on?


On valuation
In some ways, Qualcomm represents the Intel (NASDAQ:INTC) of the mobile world. It was quite a symbolic milestone when Qualcomm's market cap overtook Intel's for the first time, although Intel has since reclaimed a higher valuation. However, if we look at how the two companies stack up right now, Qualcomm's premium valuation relative to Intel may not be fully justified.

Metric

Qualcomm

Intel

P/E

16.3

13.7

P/S

4.1

2.7

Revenue growth (TTM)

6.9%

5.7%

Operating margin (TTM)

26.7%

27.4%

Return on equity (TTM)

18.8%

20.8%

TTM = TRAILING 12 MONTHS. SOURCE: REUTERS.

Qualcomm trades at a premium relative to Intel's valuation metrics, yet fundamental metrics related to growth and profitability don't do much to justify the relative premium.

On royalties
Qualcomm has a lock on 3G technologies, but Qualcomm has a relatively weaker hold on 4G technologies. To be clear, Qualcomm still enjoys its fair share of royalties, but its average royalty rate is undeniably on the decline. Its average royalty rate has fallen from an estimated 4.3% in 2008 to 3.2% in 2013.

There are a couple of other royalty headwinds going forward. Since Qualcomm's royalty depends on the prices of phones, the continued hardware commoditization that's taking place will hurt Qualcomm's piece of the action. Additionally, Qualcomm has been having trouble collecting its royalties in China, believing that local OEMs were underreporting their shipments in order to skirt paying up.

None of this is to say that Qualcomm's royalty business is falling apart; the licensing business saw revenue jump 17% last quarter. Rather, my concern is just that there are some noteworthy challenges going forward.

http://www.fool.com/investing/general/2015/06/08/why-im-selling-qualcomm.aspx?source=iaasitlnk0000003

--------------------

Why I More Than Doubled My Qualcomm, Inc. Holdings

A cheap stock with improving prospects? Count me in.

What could make the stock rise?
I view Qualcomm's technology licensing business as a stable "cash cow". The business' revenue is more or less a function of the royalty rate that Qualcomm is able to command and "total reported device sales." The smartphone market is growing, and it seems as though cellular technologies could become more prominent in other areas of computing, spanning from notebook PCs to the Internet of Things.

That's a pretty solid foundation for the company's "cash cow" wireless technology licensing business for years to come.

The chip business, on the other hand, is a bit trickier. MediaTek isn't going away, Samsung's own applications processors seem to be improving, and if Intel (NASDAQ:INTC) ever gets its act together in smartphones, the competitive environment for merchant smartphone silicon will become fiercer.

If Qualcomm can stay ahead of the competition when all is said and done, however -- and I believe Qualcomm's technology is best in class -- the company should retain solid market share, and should benefit from industrywide smartphone unit growth.

Qualcomm also has ambitions to compete outside of the traditional smartphone chip market and is aiming to attack the data center, where unit volumes are lower but average selling prices (and gross profit margins) are higher. Whether Qualcomm will ultimately be successful in leveraging its mobile technology in servers remains to be seen, as competing against Intel will be quite tough.

http://www.fool.com/investing/general/2015/06/17/why-i-more-than-doubled-my-qualcomm-inc-holdings.aspx

------------------

http://money.cnn.com/quote/quote.html?symb=QCOM

이번분기 다음분기 이 가치를 유지할수 있을지가 관건일것 같습니다.

Forward P/E (fye Sep 28, 2016)1:13.04

Profit Margin (ttm):26.03%
Operating Margin (ttm):31.24%


Growth & Valuation

Earnings growth (last year)+12.53%
Earnings growth (this year)-8.85%
Earnings growth (next 5 years)+11.50%
Revenue growth (last year)+6.52%
P/E ratio15.8
Price/Sales4.77
Price/Book2.85

Financials

Next reporting dateJuly 22, 2015
EPS forecast (this quarter)$0.95
Annual revenue (last year)$26.5B
Annual profit (last year)$7.5B
Net profit margin28.46%


Posted by 쁘레드
경제이야기/Stock2015. 6. 21. 03:35

좋은점

  • 단타가 아니라 가치투자를 하고 있다는 점. 가치를 평가하는 기준과 고르는 원칙이 나랑 비슷함.  ^^
  • 처음에 학자에서 투자자로 변신할때 책 200권을 읽고 시작했다는 점. 200권을 읽고 그 내용을 분류하고 이해하는데 탁월하셨을 거라 생각함
  • 잔고는 잔고일뿐 카이스트 교수직도 열심히 하고 있다는 점. "내가 가진 주식은 공장이다. 공장을 팔아 소비하는 사장이 없는것 처럼"
  • 다른 사람이 자기를 따라가하가는 망한다는 것을 알고 있는점
  • 비교적 겸손하신점


별로인점

  • 돈을 빌려서 주식을 한것
  • 나도 외제차 한번 타봐야지 하는 마음으로 주식을 시작한점
  • 자신의 투자 성공과 실패 분석에서 가장 중요한 운을 모르고 있다는 점

------------------


"주식 무조건 나 따라만 사면 망합니다"

[경제와 사람] 4억을 10년새 500억 만든 김봉수 카이스트 화학과 교수

손 대는 종목마다 대박 행진, 지분 보유 공시하면 주가 들썩

감성보다 합리적인 원칙 따르고 기업가치 높은 종목 장기 보유해야

500억 굴려도 점심은 콩나물국밥, 카이스트의 현인이 돼라 하더군요

다시_김봉수 카이스트 교수

http://www.hankookilbo.com/v/6985aa894101442e98b7852b419412e9


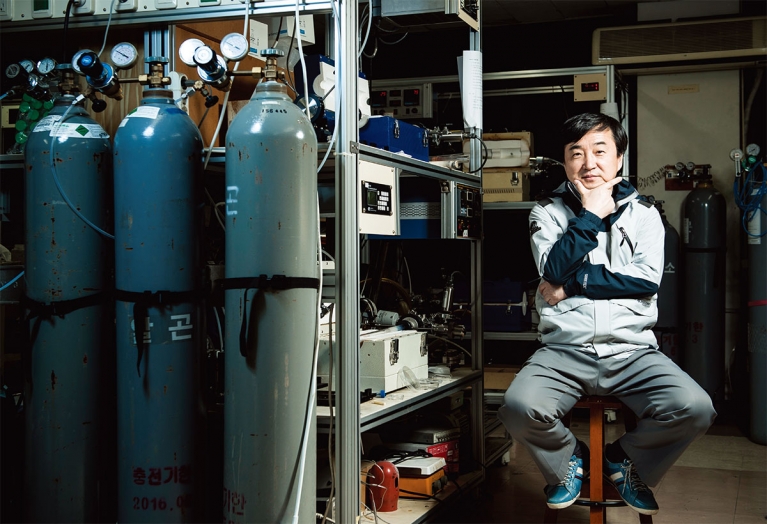
▎김봉수 교수는 화학 소재인 고어텍스로 만든 디스커버리의 바람막이를 입고 있었다. 디스커버리는 그가 투자한 에프앤에프의 아웃도어 브랜드이기도 하다. 그가 입고 있는 바람막이는 화학과 교수이면서 주식에 투자하는 그의 현재 상황을 함축하고 있는 셈이다.


https://jmagazine.joins.com/forbes/view/306194

김봉수 카이스트 화학과 교수 - 투자 수익률 300% 한국판 워런 버핏 

외제차 사려 시작한 주식투자
저평가된 부산방직 주식으로 대박
정부 정책에 주목해 투자 기업 선택해야


Posted by 쁘레드
경제이야기/Stock2015. 6. 17. 03:47

신문에서 말하는 추천주는 별 영양가는 없지만 그래도 관심있을때는 track해보는것이 좋지요

------------------

What can be better than buying great companies for the long term at a good price?

Occasionally, these opportunities occur when the markets turn south, and investors have the chance to invest in top-notch businesses at attractive valuation levels. Trying to time the markets is practically impossible, so we don't encourage it. However, being prepared with a shopping list in case there's an opportunity is a smart approach.

With this in mind, we asked our contributors to share with us three promising stocks to buy if the market crashes. Read on to see why names such as Chipotle Mexican Grill (CMG), Walmart (WMT), and Under Armour (UA) popped up during the conversation.

Brian Stoffel picks Chipotle Mexican Grill: Chipotle is one stock I'm hoping will fall significantly. Currently, the company trades for 40 times earnings and 40 times free cash flow. While that's not ridiculously expensive, I would much rather pay less.

Related: I just bought my first stock ever: Starbucks

It's impossible to deny the company's success. At a time when most restaurants would be thrilled to show a 5% gain in same-store sales, Chipotle has been producing eye-popping numbers during the past year. In 2014 alone, same-store sales increased 16.8%. I can't underscore how impressive that is for a chain that has more than 1,700 locations.

To add to it, the company has three other traits I love. First, it's led by its founder -- co-CEO Steve Ells still helps run the company he founded back in 1993.

Second, the company has optionality: It's testing different types of stores (Asian and pizza) that could replicate the main brand's success. And third, the company has a strong balance sheet with zero debt and $890 million of cash on hand.

Each of these traits, combined with the company's pricing power and strong brand appeal, make Chipotle a promising holding over the long-term.

Related: Calm down. U.S. stocks are likely to keep going up for now

Dan Caplinger picks Walmart: History shows that, even in tough financial times, you can generally count on certain companies to hold their own, and even thrive. Discount retail giant Walmart has a well-established track record of enduring past bear markets, with the Dow component being among the few stocks that managed to post positive returns during the financial crisis year of 2008.

Recently, Walmart has gone through struggles of its own, with competition attacking it from both sides. Other big-box retailers have worked hard to differentiate themselves from Walmart, with efforts to bring in name-brand designers that give their products an aura of exclusivity that stands out compared to more pedestrian offerings. At the same time, deep-discount retailers like dollar-store chains have eaten away at Walmart's base of middle-class customers, with better prices and more convenient locations.

Despite these difficulties, though, Walmart trades at a reasonable valuation of less than 15 times earnings, and has potential for further growth. With a market crash likely to hurt economic prospects for consumers across the nation, the resulting flood of bargain-hunting shoppers could actually help Walmart -- just like it did seven years ago. That's no guarantee that its stock will rise, but Walmart offers a better margin of safety than many other consumer stocks right now.

Related: Social Impact Bonds: An Exciting New Way to Invest

Andres Cardenal picks Under Armour: Under Armour is clearly firing on all cylinders on the back of growing brand recognition, a reputation for quality and innovation, and an aggressively competitive management team led by founder and CEO Kevin Plank.

Sales have increased at an amazing 29.2% annually during the last five years, and there is no slowdown in sight based on the latest financial reports. Total revenues grew 25% year over year to $805 million in the first quarter of 2015. Also, performance was quite healthy across the company's different segments: apparel sales grew 21%, footwear revenues increased 41%, and international revenues jumped 74% versus the same quarter in the prior year.

Under Armour benefits from multiple growth drivers delivering impressive performance, and the company still has a lot of room for expansion. Under Armour is still about one-tenth the size of rivalNike (NKE) on a sales basis, and the company brings in only 12% of sales from international markets, while Nike produces more than half of its revenues from abroad.

Slam dunk: Under Armour wows again

The biggest drawback for investors in Under Armour is valuation, as the stock trades at a demanding forward P/E ratio in the neighborhood of 55 times earnings forecasts for 2016. Under Armour is the typical case of a high-growth company trading for an aggressive valuation; hence, it's a great candidate to buy if market volatility provides an opportunity to invest in such a top-quality name at cheaper prices.

The Motley Fool recommends Apple, Chipotle Mexican Grill, Nike, and Under Armour. The Motley Fool owns shares of Apple, Chipotle Mexican Grill, Nike, and Under Armour.

http://money.cnn.com/2015/06/16/investing/stocks-to-buy-market-crash/index.html?iid=SF_LN

Posted by 쁘레드
경제이야기/Stock2015. 6. 1. 23:12

ADR에 대해서 항상 궁금했는데 HQCL이 ADR Ratio변경에 따른 폭락세라 ADR에 대해서 공부할수 있는 좋은 기회가 됐다. ADR은 환률에 대한 비율은 없지만 본진 주식과 해외에 다시 상장된 주식사이에 비율이 있었던것이군.


ADR : 본진 = 1: 5 에서 1:50 으로 바꾼다고 하는데. 그럼 ADR share가 10배나 더 상승하는 주식병합효과가 있는데 왜 폭락하는걸까? 페니주식을 벗어나기 위한 몸부림인데 이래도 더 떨어질 여지까지 준다고 생각하는걸까? 꼼수는 응징한다는 결과일까ㅎㅎㅎ


-------------

http://www.prnewswire.com/news-releases/hanwha-q-cells-announces-ads-ratio-change-300091369.html

EOUL, South KoreaJune 1, 2015 /PRNewswire/ -- Hanwha Q CELLS Co., Ltd. (the "Company," or "Hanwha Q CELLS"), one of the world's largest photovoltaic manufacturers of high-quality, high-efficiency solar modules, today announced that it will change the ratio of its American Depositary Shares ("ADSs") to ordinary shares from one (1) ADS representing five (5) ordinary shares to one (1) ADS representing fifty (50) ordinary shares, effective on June 15, 2015.

Each shareholder of record at the close of business on June 12, 2015 will be required to exchange every ten (10) ADSs then held for one (1) new ADS. The effect on the ADS price will take place on June 15, 2015.

For Hanwha Q CELLS's ADS holders, this ratio change will have the same effect as a one-for-ten reverse ADS split. There will be no change to Hanwha Q CELLS's underlying ordinary shares. ADS holders will be required to surrender their existing ADSs in exchange for new ADSs of the Company. The Company's Depositary, The Bank of New York Mellon, will provide further details on June 1, 2015to NASDAQ and other market participants.

About Hanwha Q CELLS

In February 2015 Hanwha Q CELLS Co., Ltd. (NASDAQ: HQCL) emerged as a new global solar power leader from combining two of the world´s most recognized photovoltaic manufacturers, Hanwha SolarOne and Hanwha Q CELLS Investment. The combined company is listed on NASDAQ under the trading symbol of HQCL. It is headquartered in Seoul, South Korea, (Global Executive Headquarters) and Thalheim, Germany (Technology & Innovation Headquarters) and is the world's largest solar cell manufacturer as well as one of the largest photovoltaic module manufacturers. Due to its diverse international footprint including facilities in China,Malaysia, and South Korea, Hanwha Q CELLS is in a unique position to flexibly address all global markets, even ones with import tariffs, such as the United States and the European Union. Based on its well respected "Engineered in Germany" technology, innovation and quality, Hanwha Q CELLS offers the full spectrum of photovoltaic products, applications and solutions, from modules to kits to systems to large scale solar power plants. Through its growing global business network spanning EuropeNorth AmericaAsia,South AmericaAfrica and the Middle East, the company provides excellent services and long-term partnership to its customers in the utility, commercial, government and residential markets. Hanwha Q CELLS is a flagship company of Hanwha Group, a FORTUNE Global 500 firm and a Top-Ten business enterprise in South Korea. For more information, visit: http://investors.hanwha-qcells.com

--------------

한화, 충북에 태양광 공장 건설…3600억 투자
2015년 06월 01일 (월)이헌규 기자  sniper@constimes.co.kr
  
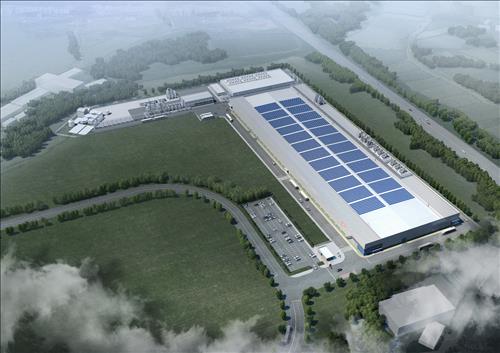
▲ 한화큐셀코리아의 진천 1.5GW 셀 공장 조감도

(건설타임즈) 이헌규 기자= 한화그룹이 충북 진천과 음성에 대규모 태양광 셀 공장을 새로 짓고 모듈 공장을 증설한다.

한화큐셀코리아(대표이사 김승모)는 충북 진천군에 1.5GW 규모의 셀 공장을 짓기로 확정했다고 1일 밝혔다. 한화큐셀은 총 3500억원을 투자한다.

한화큐셀(대표이사 남성우)은 충북 음성군에 이미 건립한 250㎿ 규모의 모듈 공장에다 250㎿ 규모의 모듈 공장을 추가로 건설, 총 500㎿ 규모의 라인을 가동하기로 했다. 모듈 라인에는 100억원이 투자된다.

셀 공장은 올해 말 준공을 목표로 하며, 증설되는 모듈 공장은 9월 준공을 예상한다. 한화큐셀이 지난해 말 착공한 음성 모듈 공장은 6월 중 상업생산에 들어간다.

1.5GW 셀 공장과 500㎿ 모듈 공장이 본격 가동되면 이 지역의 고용창출 효과만 950여명에 이를 것으로 예상된다.

한화큐셀코리아가 1.5GW의 셀 공장을 준공하면 한화그룹은 한화큐셀의 3.7GW 셀 공장에 더해 총 5.2GW 규모의 셀 양산능력을 갖추게 된다.

한화큐셀은 지난 4월 미국 2위 전력회사 넥스트에라 에너지(NextEra Energy)에 올해 4분기부터 2016년 말까지 총 1.5GW 규모(약 1조원 추정)의 모듈을 공급하는 계약을 체결했다. 태양광 업계 사상 최대 규모다.

한화는 이 계약과 추가 수주, 다운스트림 프로젝트 물량 확대에 따른 수요에 대응하고자 국내에 대규모 셀·모듈 공장을 짓기로 한 것이다.

--------------

http://www.investopedia.com/university/adr/

  • ADR Basics: Introduction
  • ADR Basics: What Is An ADR?
  • ADR Basics: Determining Price
  • ADR Basics: Risks
  • ADR Basics: Conclusion

  • American depositary receipts (ADRs)

    Posted by 쁘레드
    경제이야기/Stock2015. 5. 31. 08:43

    [이전 날짜는 20150315 였습니다.]

    그동안 아주 관심있는 종목이 변하진 않았네요. 다만 투자중인 Nuance가 좋은 성적을 내고 있어서 좋고, QCOM은 좋은 가격에 매각을 잘 해서 좋고요. Delta(DAL)는 손실구간으로 들어갔네요. 아마도 물타기 좀 해야할것 같고요. Ford가 어닝을 들으며 6개월간 이거 큰일인데 하는 마음이었는데 어떻게 할 좋은 방도가 생각이 안나네요. 계속 배당이라도 나와주니까 받아먹으며 버텨야지요.


    ----------------------

    NameSymbolLast priceMkt capAvg vol52wk high52wk lowEPSP/EBeta
    QUALCOMM, Inc.QCOM69.68113.55B10.92M81.9762.264.2216.511.19
    Apple Inc.AAPL130.28750.55B52.53M134.5488.92868.0916.110.84
    Delta Air Lines, Inc.DAL42.9435.05B12.10M51.0630.121.4130.360.79
    Tesla Motors IncTSLA250.831.70B4.60M291.42181.4-3.17na0.63
    Ford Motor CompanyF15.1860.33B24.02M18.1213.260.7819.451.53
    Nuance Communications...NUAN16.875.29B2.61M19.6113.2-0.38na1.07
    Goodyear Tire & Rubber...GT31.848.60B4.47M32.5118.879.893.222.16
    Alcoa IncAA12.5115.29B19.21M17.7512.440.5223.891.62
    Hanwha Q Cells Co Ltd...HQCL2.17216.26M467,282.002.840.92-1.11na2.54
    eBay IncEBAY61.3674.54B7.04M61.6446.342.3825.740.85
    Yahoo! Inc.YHOO42.9440.29B16.64M52.6232.93017.185.981.1
    Alibaba Group Holding...BABA89.38223.05B20.44M12077.771.8249.19
    Petroleo Brasileiro...PBR8.3652.81B42.39M20.944.9-1.13na1.88
    Semicond. Manufacturing...SMI5.664.14B72,135.006.063.880.2423.341.3
    Intel CorporationINTC34.46163.48B24.53M37.926.932.3514.640.95
    NXP Semiconductors NVNXPI112.2528.26B3.12M112.8153.812.1751.682.65
    Palo Alto Networks IncPANW169.5814.19B1.34M169.8472-1.88na
    iRobot CorporationIRBT31.95949.69M394,162.004228.051.2325.91.82

    --------------------


    3/15일 대비 수익율인데, 어마어마한 상승을 보여주는 종목이 많네요. 그남아 뉴앙스라도 들고 있다는데에 의의를 둬야할듯. 가진 종목중에 마이너스도 있고요. 헐~

    NameSymbolLast price
    of 2015/05/29
    Last price
    of 2015/03/15
    Change
    QUALCOMM, Inc.QCOM69.6868.641.52
    Apple Inc.AAPL130.28123.595.41
    Delta Air Lines, Inc.DAL42.9445.5-5.63
    Tesla Motors IncTSLA250.8188.6832.92
    Ford Motor CompanyF15.1816.2-6.30
    Nuance Communications...NUAN16.8713.8721.63
    Goodyear Tire & Rubber...GT31.8425.2426.15
    Alcoa IncAA12.5113.57-7.81
    Hanwha Q Cells Co Ltd...HQCL2.171.1195.50
    eBay IncEBAY61.3659.073.88
    Yahoo! Inc.YHOO42.9442.870.16
    Alibaba Group Holding...BABA89.3881.869.19
    Petroleo Brasileiro...PBR8.365.0166.87
    Semicond. Manufacturing...SMI5.664.331.63
    Intel CorporationINTC34.4630.9311.41
    NXP Semiconductors NVNXPI112.25104.677.24
    Palo Alto Networks IncPANW169.58141.3419.98
    iRobot CorporationIRBT31.9533.01-3.21


    '경제이야기 > Stock' 카테고리의 다른 글

    3 stocks to buy if the market crashes  (0) 2015.06.17
    한화큐셀 HQCL ADR ratio change  (0) 2015.06.01
    Delta Airlines, DAL  (0) 2015.05.31
    Nuance, NUAN 추천  (0) 2015.05.31
    IRobot, IRBT  (0) 2015.05.31
    Posted by 쁘레드
    경제이야기/Stock2015. 5. 31. 06:29

    델타 에어라인, Delta Airlines 에 투자하고 있습니다. 지금부터 여름까지 다시 기름값이 낮아질것으로 예상하고 있는데 아주 좋은 투자처가 될것 같습니다. 차트상으로도 특이하게 주기를 가지고 움직이는것이 보이는데 앞으로 다시 상승할 가능성도 높아보입니다. fundamental은 좋아지고 있는데 단기간 급락한 점도 좋게보는 이유중에 하나입니다.


    지난주에 폭락한 이유를 찾아보면, 별다른 유가하락에도 그만큼 성장을 못하고 있다는 점이 있습니다.


    Wall Street isn't happy with the airline industry.

    After three years of generally steady gains, industry shares tumbled last week, reflecting concerns over pricing and capacity. Airline shares fell 5% to 10% and about $12 billion in market capitalization was destroyed.

    Delta CEO Richard Anderson responded, "I think you are in an area that is in some respects not appropriate for an earnings call. But I will just say this: Look at our results. I don't think there is a more disciplined approach to the deployment of capital in this industry anywhere in the world."

    Recently, it seems, Delta has slowed its Seattle growth. At the same conference where Romo defended Southwest's Love Field growth, Alaska CEO Brad Tilden said, "It looks like the first quarter is the high water mark in terms of (Delta) capacity adds ... it feels to us like things are settling down a bit." If this fight is over, it seems to have turned out that Seattle is big enough for two profitable airlines to operate successful hubs -- not exactly what Wall Street anticipated. 

    -----------------------------------


    ValuationDividendFinancial ratiosMarginsProfileIncome statement
    PriceEarnings
    per share
    P/E ratioPrice
    sales ratio
    Mkt CapEnterprise
    value
    DividendCurrent
    ratio
    Total debt
    to assets
    Net profit
    margin
    Operating
    margin
    EmployeesRevenueNet incomeEBITDA
    DAL42.941.4130.360.9335.05B41,032.680.090.7117.87.9514.8981,0559,388.007462,467.00
    ALK64.654.8913.221.658.38B7,835.640.20.9411.9811.7418.7512,7391,269.00149314
    HA24.221.5715.470.611.33B1,799.3900.7937.654.7911.885,380540.2825.8896.34
    AAL42.374.589.250.7429.35B39,377.890.10.9941.069.4812.37113,3009,827.009321,912.00
    LUV37.052.0917.751.424.76B24,192.390.060.7213.5610.2617.6747,0054,414.004531,047.00
    UAL54.565.789.440.620.84B27,531.4600.6831.435.98.6184,0008,608.005081,234.00
    SKYW14.80.15102.020.25764.80M2,205.420.041.8441.391.274.4818,500760.49.6299.77
    RJET10.461.19.530.39531.70M2,689.8000.766.521.8812.085,9353416.487.2
    CEA37.782.1917.281.0115.30B31,159.970.359.037.429.4669,8497,597.77564.051,482.25
    ALGT157.476.7523.352.042.70B2,916.240.251.2147.5219.6932.832,245329.2464.82132.45
    SAVE63.573.5218.072.344.64B4,223.1201.7616.6213.9922.144,219493.3669125.13

    -----------------------------------

    KEY STATISTICS
    Industry Range: Low Light Quintile Light Quintile Dark Quintile Light Quintile Light Quintile High Mouseover quintile for more detail
     

    SHAREHOLDER EQUITY

    Shares Outstanding816.3 M
    Institutional Ownership83.05%
    Number of Floating Shares813.8 M
    Short Interest as % of Float2.26%

    FINANCIAL STRENGTH (MRQ)

    Quick Ratio0.66x
    Current Ratio0.71x
    Debt/Equity1.06x
    Debt/Assets0.18x
    DAL's debt to equity ratio indicates that it has been less aggressive with using debt to finance growth than 68% of its peers in the Airline industry. The resultant effect on earnings would be less volatile than related companies.

    VALUATION (MRQ)

    Price/Earnings (TTM)30.35x
    Price/Sales (TTM)0.86x
    Price/Book3.87x
    Price/Cash Flow7.18x
    DAL's P/E Ratio is greater than 91% of other companies in the Airline industry. This typically means that investors are willing to pay more for its level of earnings relative to future growth.

    PROFITABILITY (TTM)

    Gross Margin41.55%
    Operating Margin6.70%
    EBITDA Margin9.15%
    Net Profit Margin2.92%
    DAL's Gross Margin is more than 69% of other companies in the Airline industry, which means it has more cash to spend on business operations as compared to its peers. As indicated by the Operating Margin, DAL controls its costs and expenses as well as its peers.

    MANAGEMENT EFFECTIVENESS (TTM)

    Return on Assets2.25%
    Return on Equity11.52%
    Return on Inves. Capital3.24%
    The Return on Equity for DAL shows that it is able to reinvest its earnings less efficiently than 61% of its competitors in the Airline industry. Typically, companies that have lower return on equity values are less attractive to investors.

    GROWTH RATE (TTM)

    Earnings Per Share-88.7
    Sales6.9
    Dividend (MRQ)150.0
    DAL's EPS Growth Rate is less than 84% of its peers in the Airline industry.

    DIVIDEND (TTM)

    Dividend Yield0.84%
    Payout Ratio23.15%
    Annual Dividend0.33
    DAL's dividend yield is less than 72% of other companies in the Airline industry. As indicated by the payout ratio, DAL's earnings support the dividend payouts as well as others in the group.

    OPERATING RATIOS (TTM)

    Asset Turnover0.77%
    Inventory Turnover27.29%
    Receivables Turnover19.92%
    Effective Tax Rate38.01%
    These ratios give an indicator of efficiency (ability to move inventory and generate sales) within a company, particularly ones with tangible goods (i.e. automotive, computer hardware) as compared to its peers.

    COMPANY OFFICERS

    Non-Executive ChairmanDaniel A. Carp
    PresidentEdward H. Bastian
    Chief Executive OfficerRichard H. Anderson
    Non-Executive Vice ChairmanRoy J. Bostock
    Chief Financial OfficerPaul A. Jacobson
    Chief Operating OfficerWayne Gilbert. West
    Executive Vice PresidentJoanne D. Smith
    Executive Vice PresidentGlen W. Hauenstein
    Executive Vice PresidentRichard Ben. Hirst

    COMPANY CONTACT

    Employees81,055
    Headquarters1030 Delta Blvd
    ATLANTA, GA 30354-1989
    Phone404-715-2600
    Fax302-636-5454
    Web Address
    http://www.delta.com/
     

    -----------------------------------

    BALANCE SHEET
     5 yr Trend2010
    12/31/10
    2011
    12/31/11
    2012
    12/31/12
    2013
    12/31/13
    2014
    12/31/14

    ASSETS

    Cash & Equivalents 2,8922,6572,4162,8442,088
    Short Term Investments 7189589589591,217
    Cash and Short Term Inv 3,6103,6153,3743,8033,305
    Trade Accts Recvble, Gross 1,4961,5961,7291,6322,318
    Prov. for Doubtful Accts (40)(33)(36)(23)(21)
    Trade Accts Recvble, Net 1,4561,5631,6931,6092,297
    Other Receivables ------3925
    Total Receivables, Net 1,4561,5631,6931,6123,222
    Invent. - Raw Materials 4224681,1501,181979
    Inventories - Other (104)(101)(127)(118)(127)
    Total Inventory 3183671,0231,063852
    Prepaid Expenses 1,1591,4181,344852733
    Restricted Cash - Current 409305375----
    Deferred Income Tax 3554614631,7363,275
    Other Current Assets ------5851,078
    Other Curr. Assets, Total 7647668382,3214,353
    Total Current Assets 7,3077,7298,2729,65112,465
    Machinery/Equipment 20,31221,00121,48123,37324,313
    Construction in Progress 4877253381617
    Other Prop./Plant/Equip. 4,1114,6175,6355,8926,339
    Prop./Plant/Equip. - Gross 24,47125,69527,36929,64631,269
    Accumulated Depreciation (4,164)(5,472)(6,656)(7,792)(9,340)
    Prop./Plant/Equip. - Net 20,30720,22320,71321,85421,929
    Goodwill, Net 9,7949,7949,7949,7949,794
    Intangibles, Gross 5,2795,3515,3495,3965,396
    Accum. Intangible Amort. (530)(600)(670)(738)(793)
    Intangibles, Net 4,7494,7514,6794,6584,603
    Other Long Term Assets 1,0311,0021,0921,3031,010
    Total Assets 43,18843,49944,55052,25254,121

    LIABILITIES

    Accounts Payable 1,7131,6002,2932,3002,622
    Accrued Expenses 2,0243,2342,8084,1764,393
    Notes Payable/ST Debt 00000
    Curr. Port. LT Dbt/Cap Ls. 2,0731,9441,6271,5471,216
    Customer Advances 1,6901,8491,8061,8611,580
    Income Taxes Payable 579594585----
    Other Payables ----455----
    Other Current Liabilities 3,3063,4803,6964,2687,068
    Other Curr. Lblts, Total 5,5755,9236,5426,1298,648
    Total Current Liabilities 11,38512,70113,27014,15216,879
    Total Long Term Debt 13,17911,84711,0829,7958,561
    Total Debt 15,25213,79112,70911,3429,777
    Deferred Income Tax 1,9242,0282,047----
    Pension Benefits - Underfunded 11,49314,20016,00512,39215,138
    Other LT Liabilities 4,3104,1194,2774,2704,730
    Other Liabilities, Total 15,80318,31920,28216,66219,868
    Total Liabilities 42,29144,89546,68140,60945,308

    SHAREHOLDER EQUITY

    Common Stock 00--00
    Additional Paid-In Capital 13,92613,99914,06913,98212,981
    Ret. Earn.(Accum. Deficit) (9,252)(8,398)(7,389)3,0493,456
    Treasury Stock - Common (199)(231)(234)(258)(313)
    Unrealized Gain (Loss) (3,578)(6,766)(8,577)(26)(16)
    Min. Pension Lblty Adj. ------(5,323)(7,517)
    Other Comprehensive Income ------219222
    Other Equity, Total ------(5,104)(7,295)
    Total Equity 897(1,396)(2,131)11,6438,813
    Total Liabilities & Shareholders� Equity 43,18843,49944,55052,25254,121
    Ttl Comm. Shares Outs. 835845851851825
    Trsy. Shrs-Comm. Primary Iss. 1316161820

    () = Negative Value
    Values are displayed in Millions

    -----------------------------------

    INCOME STATEMENT
     5 yr Trend2010
    12/31/10
    2011
    12/31/11
    2012
    12/31/12
    2013
    12/31/13
    2014
    12/31/14

    REVENUE AND GROSS PROFIT

    Total Revenue 31,75535,11536,67037,77340,362

    OPERATING EXPENSES

    Cost of Revenue, Total 16,97120,60921,38620,75525,080
    Selling/Gen/Admin Expense 1,8961,9801,8621,8121,933
    Sell/Gen/AdminExpenses,Tot 8,6478,8749,1289,53210,053
    Depreciation/Amortization 1,5111,5231,5651,6581,771
    Inter/Invest Inc, Operating --------(2,346)
    Restructuring Charge 450242452402716
    Other Unusual Expnse (In) 391681180268
    Unusual Expense (Income) 841310570402984
    Other Operat Expse, Total 1,9591,8921,9642,0262,882
    Total Operating Expense 29,92933,20834,61334,37338,424
    Operating Income 1,8261,9072,0573,4001,938

    NON-OPERATING INCOME & EXPENSES

    Inter Expse,Net Non-Operat (1,220)(193)(193)(154)--
    Inter/Invest Inc, Non-Oper 35--------
    Inter Inc(Exp),Net Non-Oper --(901)(812)(698)(650)
    Other, Net (33)(44)(27)(21)(216)
    Income Before Tax 6087691,0252,5271,072

    INCOME TAXES

    Income Tax - Total 15(85)16(8,013)413
    Income After Tax 5938541,00910,540659

    MINORITY INTEREST AND EQUITY IN AFFILIATES

    Net Inc Before Extra Items 5938541,00910,540659
    Net Income 5938541,00910,540659

    ADJUSTMENTS TO NET INCOME

    Income Available to Common Excl. Extra. Items 5938541,00910,540659
    Income Available to Common Incl. Extra. Items 5938541,00910,540659

    EPS RECONCILIATION

    Basic/Primary Weighted Average Shares 834838845849836
    Basic/Primary EPS Excl. Extra. Items 0.711.021.1912.410.79
    Basic/Primary EPS Incl. Extra. Items 0.711.021.1912.410.79
    Diluted Weighted Average Shares 843844850858845
    Diluted EPS Excl. Extra. Items 0.701.011.1912.280.78
    Diluted EPS Incl. Extra. Items 0.701.011.1912.280.78

    COMMON STOCK DIVIDENDS

    Div/Share-ComStockPrimIssue 0.000.000.000.120.30
    Gross Divid - Common Stock 000102252

    PRO FORMA INCOME

    Pro Forma Net Income ----------

    SUPPLEMENTAL ITEMS

    Interest Expense, Suppl 1,220193193154--
    Depreciat/Amort, Suppl 1,5111,5231,4951,5881,716

    NORMALIZED INCOME

    Total Special Items 9943361458,243984
    Normalized Income Before Tax 1,6021,1051,17010,7702,056
    EffectSpecItemsInclTax(STEC) 2511822,885379
    InclTaxExcl/ImpactSpecItems 403318(5,128)792
    Normalized Income After Tax 1,5621,0721,15215,8981,264
    Normalized Inc Avail to Common 1,5621,0721,15215,8981,264
    Basic Normalized EPS 1.871.281.3618.731.51
    Diluted Normalized EPS 1.851.271.3518.531.50

    () = Negative Value
    Values are displayed in Millions

    -----------------------------------
    CASH FLOW STATEMENT
     5 yr Trend2010
    12/31/10
    2011
    12/31/11
    2012
    12/31/12
    2013
    12/31/13
    2014
    12/31/14

    CASH FROM (USED BY) OPERATING ACTIVITIES

    Net Income 5938541,00910,540659
    Depreciation/Depletion 1,5111,5231,5651,6581,771
    Deferred Taxes 9(2)17(7,991)414
    Unusual Items 5732102402851,026
    Equity in Net Earnings/Loss --------106
    Other Non-Cash Items (116)245(706)(255)1,973
    Non-Cash Items 457455(466)303,105
    Cash Interest Pd, Suppl 1,0369251,036698560
    Accounts Receivable (141)(76)(116)90(302)
    Prepaid Expenses (105)(16)(134)2858
    Other Assets 0(24)----(922)
    Payable/Accrued 516303899213228
    Changes in Working Capital 2624351267(1,002)
    Total Cash from Operations 2,8322,8342,4764,5044,947

    PLUS: CASH FROM (USED BY) INVESTING ACTIVITIES

    Capital Expenditures (1,342)(1,254)(1,968)(2,568)(2,249)
    Sale of Fixed Assets 36--------
    Sale/Maturity of Investment --------1,533
    Investment, Net (730)8441,019757--
    Purchase of Investments --(1,078)(958)(959)(1,795)
    Other Investing Cash Flow 10(10)(55)1448
    OtherInvestCashFlowItms,Tot (684)(244)6(188)(214)
    Total Cash from Investing (2,026)(1,498)(1,962)(2,756)(2,463)

    PLUS: CASH FROM (USED BY) FINANCING ACTIVITIES

    Financing Cash Flow Items 7120614422519
    Total Cash Dividends Paid ------(102)(251)
    Iss (Retirmnt) of Stock,Net ------(250)(1,100)
    Long Term Debt Issued 1,1302,3951,9652681,020
    Long Term Debt Reduction (3,722)(4,172)(2,864)(1,461)(2,928)
    Iss (Retirmnt) of Debt, Net (2,592)(1,777)(899)(1,193)(1,908)
    Total Cash From Financing (2,521)(1,571)(755)(1,320)(3,240)

    EQUALS: INCREASE (DECREASE) IN CASH

    Net Change in Cash (1,715)(235)(241)428(756)
    NetCash-BeginBal/RsvdforFutUse 4,6072,8922,6572,4162,844
    NetCash-EndBal/RsrvforFutUse 2,8922,6572,4162,8442,088
    Depreciation, Supplemental 1,5111,5231,5651,6581,771
    Cash Interest Pd, Suppl 1,0369251,036698560

    () = Negative Value
    Values are displayed in Millions


    '경제이야기 > Stock' 카테고리의 다른 글

    한화큐셀 HQCL ADR ratio change  (0) 2015.06.01
    20150529 아주 관심있는 종목 리스트  (0) 2015.05.31
    Nuance, NUAN 추천  (0) 2015.05.31
    IRobot, IRBT  (0) 2015.05.31
    숫자분석의 달인 quantifiedalpha.com  (0) 2015.05.13
    Posted by 쁘레드
    경제이야기/Stock2015. 5. 31. 06:12

    Nuance = 뉴앙스, 누앙스, 뉘앙스


    Apple의 Siri가 처음 나온것은 2011년 10월 Iphone 4S에서 부터였습니다.

    Google Android의 경우 2010년 Goole I/O에서 voice recognition을 데모했었습니다. 2013년에 Google Now를 선보였고요.

    2013년에 놀러갔다가 시리를 정말 잘쓰는 사람을 보고 앞으로 세상의 input은 keyboard가 아니라 voice라는 깨닮음을 얻고 Nuance를 살펴보다가 투자를 단행했습니다. 애플이랑 결별할지도 모른다는 rumor가 있었고, 주요 IT업체였던 Apple, Google, Microsoft 세 회사가 자체 voice recognition solution이 있었다는 것도 risk factor였는데 아이칸이 투자했다는 이야기에 좀더 서두르게 되서 한동한 손실에 시달렸어야 했지요. 물타기를 최저가 근처에서 많이해서 2015년 투자수익률을 NUAN가 주도하고 있습니다. 아직도 가치를 더 높게 보는 이유가


    1. 매출과 순이익의 반이 Healthcare쪽에서 나오고 성장률이 상당히 높습니다.

    2. IT쪽 매출과 발전이 상당히 느렸는데 smart automotive(자동차)쪽에 성장이 상당히 빠른것 같습니다. 1-2년 성장이 빠를것 같습니다. Wearable이 늘어날수록 voice 쪽 솔루션이 계속 필요합니다.

    3. 라이센스 비용이 좀 비싸서 누군가 라이센스를 내는것보다 사는것이 낫다는 판단을 할 가능성이 높습니다. 헬스케어와 voice recognition solution 둘다 필요한 회사가 가장 적합하겠지요. 

    4. 아직까지 돈을 못벌고 있는데 현금흐름도 좋아지고 이득도 늘고있어 주가가 폭등할 좋은 모멤텀이 쌓이고 있습니다.


    Nuance의 4가지 분야는, 아래와 같고 전세계적으로 유명한 고객사를 가지고 있습니다.

    Healthcare

    Mobile & Consumer

    Enterprise

    Imaging

    -------------------------


    ValuationDividendFinancial ratiosMarginsProfileIncome statement
    PriceEarnings
    per share
    P/E ratioPrice
    sales ratio
    Mkt CapEnterprise
    value
    DividendCurrent
    ratio
    Total debt
    to assets
    Net profit
    margin
    Operating
    margin
    EmployeesRevenueNet incomeEBITDA
    NUAN16.87-0.382.785.29B6,899.1701.8137.92-2.975.5714,000475.06-14.189.52
    MSFT46.862.4119.474.35379.08B315,789.500.312.9118.0422.9429.91128,00021,729.004,985.009,390.00
    HPQ33.392.513.360.5960.69B67,397.4601.1320.773.975.62302,00025,453.001,011.002,977.00
    CSCO29.311.7316.993.06149.07B115,662.400.212.9819.7820.0824.174,04212,137.002,437.003,516.00
    XRX11.420.8613.320.712.59B19,699.770.071.4628.53.625.55145,6004,469.00162557
    WSTC30.61.619.171.132.55B5,870.450.221.5297.878.619.579,700565.4948.63157.61
    ADBE79.090.6131.078.8939.57B38,291.0802.2217.277.6515.612,4991,109.1884.89254.42
    INTC34.462.3514.643.19163.48B162,593.200.481.7614.7715.5920.16106,70012,781.001,992.004,819.00
    DELL05.9100.42150,032.200.621.1814.851.411.87108,800112,512.501,581.415,317.87
    ORCL43.492.3918.25.08189.92B177,816.900.123.7231.6126.7536.27122,0009,327.002,495.004,144.00
    IBM169.6815.7510.772.13167.09B197,231.101.11.334.6612.3315.32379,59219,590.002,416.004,044.00


    -------------------------


    KEY STATISTICS
    Industry Range: Low Light Quintile Light Quintile Dark Quintile Light Quintile Light Quintile High Mouseover quintile for more detail
     

    SHAREHOLDER EQUITY

    Shares Outstanding313.8 M
    Institutional Ownership79.28%
    Number of Floating Shares309.2 M
    Short Interest as % of Float4.52%

    FINANCIAL STRENGTH (MRQ)

    Quick Ratio-- 
    Current Ratio1.81x
    Debt/Equity0.89x
    Debt/Assets0.38x
    NUAN's debt to equity ratio indicates that it has been more aggressive with using debt to finance growth than 70% of its peers in the Software & Programming industry. The resultant effect on earnings would be more volatile than related companies.

    VALUATION (MRQ)

    Price/Earnings (TTM)-- 
    Price/Sales (TTM)2.75x
    Price/Book2.23x
    Price/Cash Flow30.88x
    NUAN was not profitable in its latest fiscal year, therefore the P/E Ratiois not applicable. Its Price to Cash Flow Ratio would give an alternative indication of its expense relative to the Software & Programming industry.

    PROFITABILITY (TTM)

    Gross Margin56.41%
    Operating Margin0.30%
    EBITDA Margin14.05%
    Net Profit Margin-6.24%
    NUAN's Gross Margin is comparable to other companies in the Software & Programming industry, which means it has relatively the same amount of cash to spend on business operations as its peers. As indicated by the Operating Margin, NUAN controls its costs and expenses better than 67% of its peers.

    MANAGEMENT EFFECTIVENESS (TTM)

    Return on Assets-2.06%
    Return on Equity-4.81%
    Return on Inves. Capital-2.35%
    The Return on Equity for NUAN shows that it is able to reinvest its earnings as efficiently as its competitors in the Software & Programming industry. Typically, companies that have higher return on equity values are more attractive to investors.

    GROWTH RATE (TTM)

    Earnings Per Share26.9
    Sales2.1
    Dividend (MRQ)-- 
    NUAN's EPS Growth Rate is greater than 61% of its peers in the Software & Programming industry.

    DIVIDEND (TTM)

    Dividend Yield-- 
    Payout Ratio-- 
    Annual Dividend0.00 
    The average dividend yield for companies in the Software & Programming industry is 1.55%.

    OPERATING RATIOS (TTM)

    Asset Turnover0.33%
    Inventory Turnover-- 
    Receivables Turnover4.93%
    Effective Tax Rate-- 
    These ratios give an indicator of efficiency (ability to move inventory and generate sales) within a company, particularly ones with tangible goods (i.e. automotive, computer hardware) as compared to its peers.

    COMPANY OFFICERS

    ChairmanPaul A. Ricci
    Executive Vice President - FinanceThomas L. Beaudoin
    Corporate ExecutiveEarl H. Devanny
    Executive Vice PresidentWilliam Robbins
    Executive Vice PresidentAdam Bruce. Bowden
    Lead DirectorRobert J. Frankenberg
    DirectorRobert J. Finocchio
    Independent DirectorBrett M. Icahn
    Independent DirectorWilliam H. Janeway

    COMPANY CONTACT

    Employees14,000
    Headquarters1 Wayside Rd
    BURLINGTON, MA 01803-4609
    Phone781-565-5000
    Fax781-565-5001
    Web Address
    http://www.nuance.com
     

    -------------------------

    BALANCE SHEET
     5 yr Trend2010
    09/30/10
    2011
    09/30/11
    2012
    09/30/12
    2013
    09/30/13
    2014
    09/30/14

    ASSETS

    Cash & Equivalents 5174471,130808547
    Short Term Investments 53103941
    Cash and Short Term Inv 5224781,130847588
    Trade Accts Recvble, Gross 224287388397450
    Prov. for Doubtful Accts (6)(6)(7)(14)(21)
    Total Receivables, Net 225281381383428
    Invent. - Finished Goods 25434
    Inventories - Other 678129
    Total Inventory 911111512
    Prepaid Expenses 6277918880
    Restricted Cash - Current 2570----
    Deferred Income Tax --0887556
    Other Current Assets ------20
    Other Curr. Assets, Total 257887756
    Total Current Assets 8428551,7011,4101,165
    Buildings 2125273240
    Land/Improvements 22222
    Machinery/Equipment 125162224303370
    Construction in Progress 13224
    Prop./Plant/Equip. - Gross 149192255339417
    Accumulated Depreciation (87)(113)(139)(178)(225)
    Prop./Plant/Equip. - Net 6278116161191
    Goodwill, Net 2,0782,3482,9553,2933,411
    Intangibles, Gross 1,0591,2271,4841,5861,632
    Accum. Intangible Amort. (373)(496)(577)(633)(716)
    Intangibles, Net 686732907953915
    Long Term Investments 28--------
    Other Long Term Assets 7483120142138
    Total Assets 3,7704,0955,7995,9595,820

    LIABILITIES

    Accounts Payable 79831139162
    Accrued Expenses 147172211181210
    Notes Payable/ST Debt 00000
    Curr. Port. LT Dbt/Cap Ls. 873802465
    Customer Advances 142186207254298
    Income Taxes Payable 445----
    Deferred Income Tax 0--------
    Other Current Liabilities 224503468
    Other Curr. Lblts, Total 149214261287366
    Total Current Liabilities 382475965805642
    Total Long Term Debt 8518531,7362,1082,127
    Total Debt 8598602,1162,3542,132
    Deferred Income Tax 6472161163156
    Other Liabilities, Total 175202210244313
    Total Liabilities 1,4731,6023,0713,3213,238

    SHAREHOLDER EQUITY

    Pref. Stock-Non Rdmbl, Net 555----
    Common Stock 00000
    Additional Paid-In Capital 2,5822,7462,9083,0173,153
    Ret. Earn.(Accum. Deficit) (281)(243)(161)(369)(531)
    Treasury Stock - Common (17)(17)(17)(17)(17)
    Unrealized Gain (Loss) 000----
    Cum. Trans. Adjustment 134(3)8(20)
    Min. Pension Lblty Adj. (5)(2)(4)(1)(4)
    Other Comprehensive Income 000----
    Other Equity, Total 82(7)7(24)
    Total Equity 2,2972,4932,7282,6382,582
    Total Liabilities & Shareholders� Equity 3,7704,0955,7995,9595,820
    Shr Outs.-Com. Primary Iss. 298309312316321
    Shr Outs.-Com. Stk. Iss. 2 444----
    Ttl Comm. Shares Outs. 302312316316321
    Trsy. Shrs-Comm. Primary Iss. 44444
    Trsy. Shrs-Comm. Iss. 2 000----

    () = Negative Value
    Values are displayed in Millions

    -------------------------

    INCOME STATEMENT
     5 yr Trend2010
    09/30/10
    2011
    09/30/11
    2012
    09/30/12
    2013
    09/30/13
    2014
    09/30/14

    REVENUE AND GROSS PROFIT

    Total Revenue 1,1191,3191,6521,8551,923

    OPERATING EXPENSES

    Cost of Revenue, Total 409500605767844
    Selling/Gen/Admin Expense 388454415495497
    Sell/Gen/AdminExpenses,Tot 388454533600609
    Research & Development 152179225289339
    Depreciation/Amortization 888895105109
    Purchased R&D Written-Off 0--------
    Restructuring Charge 182381619
    Other Unusual Expnse (In) 3122593024
    Unusual Expense (Income) 4945674644
    Total Operating Expense 1,0861,2661,5251,8071,945
    Operating Income 335312648(21)

    NON-OPERATING INCOME & EXPENSES

    Inter Expse,Net Non-Operat (41)(37)(85)(138)(133)
    Inter Income, Non-Operating 13222
    Invest Income, Non-Operat ----6(4)(7)
    Inter/Invest Inc, Non-Oper 138(3)(4)
    OtherNon-OperatInc (Expnse) 61116(5)3
    Other, Net 61116(5)3
    Income Before Tax (1)3065(97)(155)

    INCOME TAXES

    Income Tax - Total 18(8)(142)19(5)
    Income After Tax (19)38207(115)(150)

    MINORITY INTEREST AND EQUITY IN AFFILIATES

    Net Inc Before Extra Items (19)38207(115)(150)
    Net Income (19)38207(115)(150)

    ADJUSTMENTS TO NET INCOME

    Total Adjust to Net Income 00(2)00
    Income Available to Common Excl. Extra. Items (19)38205(115)(150)
    Income Available to Common Incl. Extra. Items (19)38205(115)(150)

    EPS RECONCILIATION

    Basic/Primary Weighted Average Shares 287302306314317
    Basic/Primary EPS Excl. Extra. Items (0.07)0.130.67(0.37)(0.47)
    Basic/Primary EPS Incl. Extra. Items (0.07)0.130.67(0.37)(0.47)
    Dilution Adjustment 00200
    Diluted Weighted Average Shares 287316321314317
    Diluted EPS Excl. Extra. Items (0.07)0.120.65(0.37)(0.47)
    Diluted EPS Incl. Extra. Items (0.07)0.120.65(0.37)(0.47)

    COMMON STOCK DIVIDENDS

    Div/Share-ComStockPrimIssue 0.000.000.000.000.00
    Gross Divid - Common Stock 00000

    PRO FORMA INCOME

    Pro Forma Net Income ----------

    SUPPLEMENTAL ITEMS

    Interest Expense, Suppl 413785138133
    Depreciat/Amort, Suppl 2228324052

    NORMALIZED INCOME

    Total Special Items 4945674644
    Normalized Income Before Tax 4775132(51)(111)
    EffectSpecItemsInclTax(STEC) 1716231615
    InclTaxExcl/ImpactSpecItems 357(118)3511
    Normalized Income After Tax 1267251(85)(122)
    Normalized Inc Avail to Common 1267248(85)(122)
    Basic Normalized EPS 0.040.220.81(0.27)(0.38)
    Diluted Normalized EPS 0.040.210.78(0.27)(0.38)

    () = Negative Value
    Values are displayed in Millions

    -------------------------

    CASH FLOW STATEMENT
     5 yr Trend2010
    09/30/10
    2011
    09/30/11
    2012
    09/30/12
    2013
    09/30/13
    2014
    09/30/14

    CASH FROM (USED BY) OPERATING ACTIVITIES

    Net Income (19,099)38,238207,135(115,238)(150,343)
    Depreciation/Depletion 157,156170,933187,183208,659221,776
    Deferred Taxes 3,742(43,890)(151,547)(2,472)(22,172)
    Unusual Items 6,83311,72500--
    Other Non-Cash Items 114,670176,298200,368193,597221,957
    Non-Cash Items 121,503188,023200,368193,597221,957
    Cash Taxes Pd, Supplemental 14,21515,94913,29218,32915,591
    Cash Interest Pd, Suppl 27,89923,03436,90795,72796,743
    Accounts Receivable (773)(25,530)(55,210)25,165(39,502)
    Prepaid Expenses (3,840)(11,793)13,88110,988(396)
    Accounts Payable 4,710(8,193)22,645(26,843)(28,617)
    Accrued Expenses (6,760)(6,775)8,93916,50613,617
    Changes in Working Capital 32,9804,10729,860110,46486,929
    Total Cash from Operations 296,282357,411472,999395,010358,147

    PLUS: CASH FROM (USED BY) INVESTING ACTIVITIES

    Purchase of Fixed Assets (25,974)(34,907)(62,910)(55,588)(60,287)
    Purchase/Acq of Intangibles (15,300)(6,715)------
    Capital Expenditures (41,274)(41,622)(62,910)(55,588)(60,287)
    Acquisition of Business (203,729)(402,290)(884,945)(607,653)(253,000)
    Sale/Maturity of Investment 011,65031,7898,76864,975
    Purchase of Investments (48,499)(10,776)(15,156)(39,435)(62,639)
    Other Investing Cash Flow (22,070)17,1846,74700
    OtherInvestCashFlowItms,Tot (274,298)(384,232)(861,565)(638,320)(250,664)
    Total Cash from Investing (315,572)(425,854)(924,475)(693,908)(310,951)

    PLUS: CASH FROM (USED BY) FINANCING ACTIVITIES

    Financing Cash Flow Items (13,650)(12,527)1,320,415560,837(45,407)
    Sale/Issuance of Common 41,86036,66727,74730,21622,652
    Repurch/Retirement Common 00(199,997)(184,388)(26,483)
    Iss (Retirmnt) of Stock,Net 41,86036,667(172,250)(154,172)(3,831)
    Short Term Debt Reduction (8,460)(7,535)(6,605)(425,634)--
    Short Term Debt, Net (8,460)(7,535)(6,605)(425,634)--
    Long Term Debt, Net (9,870)(10,643)(8,525)(1,688)(257,928)
    Iss (Retirmnt) of Debt, Net (18,330)(18,178)(15,130)(427,322)(257,928)
    Total Cash From Financing 9,8805,9621,133,035(20,657)(307,166)

    EQUALS: INCREASE (DECREASE) IN CASH

    Foreign Exchange Effects (998)(6,925)978(2,088)(918)
    Net Change in Cash (10,408)(69,406)682,537(321,643)(260,888)
    NetCash-BeginBal/RsvdforFutUse 527,038516,630447,2241,129,761808,118
    NetCash-EndBal/RsrvforFutUse 516,630447,2241,129,761808,118547,230
    Depreciation, Supplemental 157,156170,933187,183208,659221,776
    Cash Interest Pd, Suppl 27,89923,03436,90795,72796,743
    Cash Taxes Pd, Supplemental 14,21515,94913,29218,32915,591

    () = Negative Value
    Values are displayed in Thousands


    '경제이야기 > Stock' 카테고리의 다른 글

    20150529 아주 관심있는 종목 리스트  (0) 2015.05.31
    Delta Airlines, DAL  (0) 2015.05.31
    IRobot, IRBT  (0) 2015.05.31
    숫자분석의 달인 quantifiedalpha.com  (0) 2015.05.13
    19 stocks to buy now - CNNMoney  (0) 2015.03.28
    Posted by 쁘레드
    경제이야기/Stock2015. 5. 31. 05:32


    작년말에 IRobot Roomba를 처음샀습니다. 가정에서 매주 하는 청소에 대해서 새로운 역사를 쓰는것 같습니다. 이런거 로봇으로 대체할수 없을까 했는데 상당히 만족하고 있습니다. 저런것이 잘 될까했는데 많은 분들이 상당히 마음에 든다고 하셔서 구입한거 였습니다. 제가 이것을 구입한 이후로 주변에 이런게 될까 고민하는 많은 사람에게 강추를 몇번 날렸습니다. 


    그런 제 모습을 보며 이 회사에 투자를 해야겠다고 생각하고 있습니다. 회사를 조사해 보니 제가 맘에 든느 부분은 For The HOME 부분 인데 For the Business는 제품도 별로고 판매도 별로일것 같고요. For Defense & Security는 상당히 좋을것이라고 생각됩니다.각 부문이 매출과 이득에 차치하는 비율을 잘 계산해본다음에 추천일까 아닐까를 update할까합니다. (청소로봇 룸바와 브라바는 무조건 강추입니다.)


    지금 인기를 끌고 있는 Drone쪽으로 룸바같은것을 만들면 완전 이회사 대박일것이라고 생각됩니다. 이미 기술을 다 가지고 있고 많은 사람들이 필요로하는 demand를 잘 파악해야겠지요.

    ------------------------


    ------------------------

    KEY STATISTICS
    Industry Range: Low Light Quintile Light Quintile Dark Quintile Light Quintile Light Quintile High Mouseover quintile for more detail
     

    SHAREHOLDER EQUITY

    Shares Outstanding29.7 M
    Institutional Ownership68.84%
    Number of Floating Shares28.8 M
    Short Interest as % of Float13.78%

    FINANCIAL STRENGTH (MRQ)

    Quick Ratio4.88x
    Current Ratio5.72x
    Debt/Equity0.00x 
    Debt/Assets0.00x 

    VALUATION (MRQ)

    Price/Earnings (TTM)25.90x
    Price/Sales (TTM)1.69x
    Price/Book2.41x
    Price/Cash Flow28.48x
    IRBT's P/E Ratio is greater than 79% of other companies in the Appliance & Tool industry. This typically means that investors are willing to pay more for its level of earnings relative to future growth.

    PROFITABILITY (TTM)

    Gross Margin46.39%
    Operating Margin9.46%
    EBITDA Margin11.86%
    Net Profit Margin6.65%
    IRBT's Gross Margin is more than 87% of other companies in the Appliance & Tool industry, which means it has more cash to spend on business operations as compared to its peers. As indicated by theOperating Margin, IRBT controls its costs and expenses better than 75% of its peers.

    MANAGEMENT EFFECTIVENESS (TTM)

    Return on Assets8.58%
    Return on Equity10.06%
    Return on Inves. Capital9.95%
    The Return on Equity for IRBT shows that it is able to reinvest its earnings as efficiently as its competitors in the Appliance & Tool industry. Typically, companies that have higher return on equity values are more attractive to investors.

    GROWTH RATE (TTM)

    Earnings Per Share48.6
    Sales13.2
    Dividend (MRQ)-- 
    IRBT's EPS Growth Rate is greater than 72% of its peers in the Appliance & Tool industry.

    DIVIDEND (TTM)

    Dividend Yield-- 
    Payout Ratio0.00% 
    Annual Dividend0.00 
    The average dividend yield for companies in the Appliance & Tool industry is 1.44%.

    OPERATING RATIOS (TTM)

    Asset Turnover1.29%
    Inventory Turnover6.60%
    Receivables Turnover14.79%
    Effective Tax Rate27.93%
    These ratios give an indicator of efficiency (ability to move inventory and generate sales) within a company, particularly ones with tangible goods (i.e. automotive, computer hardware) as compared to its peers.

    COMPANY OFFICERS

    ChairmanColin M. Angle
    Chief Financial OfficerAlison Dean
    Executive Vice PresidentPaolo Pirjanian
    Executive Vice PresidentGlen D. Weinstein
    Executive Vice PresidentRussell J. Campanello
    Senior Vice PresidentChristian Cerda
    Lead DirectorGeorge C. McNamee
    Independent DirectorRonald D. Chwang
    Independent DirectorGail Deegan

    COMPANY CONTACT

    Employees589
    Headquarters8 Crosby Dr
    BEDFORD, MA 01730-1402
    Phone781-430-3000
    Fax781-430-3001
    Web Address
    http://www.irobot.com/
     

    ------------------------


    BALANCE SHEET

     5 yr Trend2011
    01/01/11
    2011
    12/31/11
    2012
    12/29/12
    2013
    12/28/13
    2014
    12/27/14

    ASSETS

    Cash & Equivalents 108,383166,308126,770165,404185,957
    Short Term Investments 13,92817,81112,43021,95436,166
    Cash and Short Term Inv 122,311184,119139,200187,358222,123
    Trade Accts Recvble, Gross 34,14443,42529,52439,41571,123
    Prov. for Doubtful Accts (88)(87)(111)(67)(67)
    Total Receivables, Net 38,06845,70030,60940,20473,670
    Invent. - Finished Goods 20,41023,32028,05637,58738,402
    Invent. - Work In Progress 2706000
    Invent. - Raw Materials 6,7237,7698,8498,5209,455
    Total Inventory 27,16031,08936,96546,10747,857
    Deferred Income Tax 12,91715,34419,26620,14421,505
    Other Current Assets 6,1377,9288,8536,8489,704
    Other Curr. Assets, Total 19,05423,27228,11926,99231,209
    Total Current Assets 206,593284,180234,893300,661374,859
    Buildings 13,53215,45915,75815,98320,833
    Machinery/Equipment 29,81736,63237,89737,81047,308
    Other Prop./Plant/Equip. 2,4842,7322,7621,8452,297
    Prop./Plant/Equip. - Gross 45,83354,82356,41755,63870,438
    Accumulated Depreciation (20,213)(25,794)(31,464)(31,977)(39,141)
    Prop./Plant/Equip. - Net 25,62029,02924,95323,66131,297
    Goodwill, Net 7,9107,91048,95148,75148,751
    Intangibles, Gross 4,5004,50031,50031,50031,500
    Accum. Intangible Amort. (1,130)(2,033)(3,276)(8,832)(12,354)
    Intangibles, Net 3,3702,46728,22422,66819,146
    Long Term Investments 2,5002,500--10,50110,751
    Other Long Term Assets ----8,500----
    Total Assets 254,331332,213354,313416,337493,213

    LIABILITIES

    Accounts Payable 38,68948,40642,51541,34460,256
    Accrued Expenses 33,61734,11024,78733,55233,367
    Notes Payable/ST Debt 00000
    Customer Advances 3,5341,5276,2575,1884,551
    Income Taxes Payable --957719831867
    Other Curr. Lblts, Total 3,5342,4846,9766,0195,418
    Total Current Liabilities 75,84085,00074,27880,91599,041
    Total Long Term Debt 00000
    Total Debt 00000
    Other Liabilities, Total 3,5844,2554,2184,7333,736
    Total Liabilities 79,42489,25578,49685,648102,777

    SHAREHOLDER EQUITY

    Redeemable Preferred Stock 0--000
    Common Stock 258272278289297
    Additional Paid-In Capital 156,620184,395199,903227,175249,409
    Ret. Earn.(Accum. Deficit) 17,94958,14075,437103,078140,881
    Other Equity, Total 80151199147(151)
    Total Equity 174,907242,958275,817330,689390,436
    Total Liabilities & Shareholders� Equity 254,331332,213354,313416,337493,213
    Ttl Comm. Shares Outs. 25,84527,21727,78228,93529,645
    Trsy. Shrs-Comm. Primary Iss. 00000

    ------------------------


    INCOME STATEMENT

     5 yr Trend2011
    01/01/11
    2011
    12/31/11
    2012
    12/29/12
    2013
    12/28/13
    2014
    12/27/14

    REVENUE AND GROSS PROFIT

    Total Revenue 401466436487557

    OPERATING EXPENSES

    Cost of Revenue, Total 256258242266299
    Selling/Gen/Admin Expense 8788104115126
    Sell/Gen/AdminExpenses,Tot 8794112125136
    Research & Development 2560576469
    Total Operating Expense 367412411455504
    Operating Income 3353253353

    NON-OPERATING INCOME & EXPENSES

    Other, Net 1000(1)
    Income Before Tax 3454263252

    INCOME TAXES

    Income Tax - Total 8138515
    Income After Tax 2640172838

    MINORITY INTEREST AND EQUITY IN AFFILIATES

    Net Inc Before Extra Items 2640172838
    Net Income 2640172838

    ADJUSTMENTS TO NET INCOME

    Income Available to Common Excl. Extra. Items 2640172838
    Income Available to Common Incl. Extra. Items 2640172838

    EPS RECONCILIATION

    Basic/Primary Weighted Average Shares 2527282829
    Basic/Primary EPS Excl. Extra. Items 1.001.500.630.971.28
    Basic/Primary EPS Incl. Extra. Items 1.001.500.630.971.28
    Dilution Adjustment 00------
    Diluted Weighted Average Shares 2628282930
    Diluted EPS Excl. Extra. Items 0.961.440.610.941.25
    Diluted EPS Incl. Extra. Items 0.961.440.610.941.25

    COMMON STOCK DIVIDENDS

    Div/Share-ComStockPrimIssue 0.000.000.000.000.00
    Gross Divid - Common Stock 00000

    PRO FORMA INCOME

    Pro Forma Net Income ----------

    SUPPLEMENTAL ITEMS

    Depreciat/Amort, Suppl 710121213

    NORMALIZED INCOME

    Total Special Items 0--------
    Normalized Income Before Tax 3454263252
    EffectSpecItemsInclTax(STEC) 0--------
    InclTaxExcl/ImpactSpecItems 9138515
    Normalized Income After Tax 2640172838
    Normalized Inc Avail to Common 2640172838
    Basic Normalized EPS 1.021.500.630.971.28
    Diluted Normalized EPS 0.971.440.610.941.25

    ------------------------

    CASH FLOW STATEMENT

     5 yr Trend2011
    01/01/11
    2011
    12/31/11
    2012
    12/29/12
    2013
    12/28/13
    2014
    12/27/14

    CASH FROM (USED BY) OPERATING ACTIVITIES

    Net Income 25,51440,19117,29727,64137,803
    Depreciation/Depletion 7,54110,31211,67212,16913,049
    Deferred Taxes (4,998)6,154(3,763)(768)3,101
    Unusual Items 2045991,3322,177246
    Other Non-Cash Items 5,6752,0299,62511,04710,776
    Non-Cash Items 5,8792,62810,95713,22411,022
    Cash Taxes Pd, Supplemental 17,8078,04611,6637,23515,508
    Accounts Receivable (1,066)(7,632)16,726(9,595)(33,466)
    Inventories 5,246(3,929)(807)(9,365)(2,387)
    Other Assets (2,082)(1,843)(2,892)1,980(2,856)
    Accounts Payable 8,1309,717(8,684)(1,743)16,249
    Accrued Expenses 5,7971,473(6,762)9,006324
    Changes in Working Capital 15,221(3,550)1,698(10,374)(24,369)
    Total Cash from Operations 49,15755,73537,86141,89240,606

    PLUS: CASH FROM (USED BY) INVESTING ACTIVITIES

    Capital Expenditures (12,597)(13,011)(6,770)(6,829)(13,774)
    Acquisition of Business 00(74,530)00
    Sale of Fixed Assets ------6500
    Sale/Maturity of Investment 21,5005,00010,0008,04416,500
    Purchase of Investments (30,461)(9,189)(5,086)(17,946)(31,219)
    Other Investing Cash Flow 00(6,000)(2,000)(250)
    OtherInvestCashFlowItms,Tot (8,961)(4,189)(75,616)(11,252)(14,969)
    Total Cash from Investing (21,558)(17,200)(82,386)(18,081)(28,743)

    PLUS: CASH FROM (USED BY) FINANCING ACTIVITIES

    Financing Cash Flow Items 2,3385,9896611,1941,425
    Common Stock, Net --------(1,678)
    Options Exercised 6,59013,4014,32613,6298,943
    Iss (Retirmnt) of Stock,Net 6,59013,4014,32613,6297,265
    Total Cash From Financing 8,92819,3904,98714,8238,690

    EQUALS: INCREASE (DECREASE) IN CASH

    Net Change in Cash 36,52757,925(39,538)38,63420,553
    NetCash-BeginBal/RsvdforFutUse 71,856108,383166,308126,770165,404
    NetCash-EndBal/RsrvforFutUse 108,383166,308126,770165,404185,957
    Depreciation, Supplemental 7,54110,31211,67212,16913,049
    Cash Taxes Pd, Supplemental 17,8078,04611,6637,23515,508

    ------------------------


    '경제이야기 > Stock' 카테고리의 다른 글

    Delta Airlines, DAL  (0) 2015.05.31
    Nuance, NUAN 추천  (0) 2015.05.31
    숫자분석의 달인 quantifiedalpha.com  (0) 2015.05.13
    19 stocks to buy now - CNNMoney  (0) 2015.03.28
    Should You Consider Nuance Communications?  (0) 2015.03.24
    Posted by 쁘레드
    경제이야기/Stock2015. 5. 13. 06:24

    Seekingalpha에서 글을 보다가 GT(Goodyear tire)가 undervalue되었있다고 주장하는 글을 읽다가 상당히 재밌는 사이트를 알게됐습니다. 수치해석, 통계, 숫자표현 이런것에 능한사람이 만든것 같습니다. seekingalpha와 자매사이트 같기도 하고요. 다 맞다고 하는것은 아니고요, 계산 geeks들은 어떻게 계산하는지 같이 계산기 뚜드리는지 이해해 보고 싶습니다.


    내용이 재밌어서 평소 관심있는 종목들을 넣어봤습니다.

    https://quantifiedalpha.com/


    ---------------

    GT(Goodyear TIre)

    Market Cap: $7.55B (Mid Cap)
    Market Beta: 2.23 (Very High Market Risk)
    MetricGTPercentileAnalysis
    10.25%98thStrongly Undervalued
    4.50%91stStrong Growth
    -5.29%14thBad Quality
    1.78%67thSlightly Bullish
    11.24%90thModerate Outperform

    78
    Days
    $0.75$4.10B

    -------------

    AA(Alcoa)

    Market Cap: $16.89B (Large Cap)
    Market Beta: 1.64 (High Market Risk)
    MetricAAPercentileAnalysis
    4.21%78thModerately Undervalued
    -0.61%35thWeak Growth
    -1.98%28thMediocre Quality
    -2.47%23rdModerately Bearish
    -0.84%40thSlight Underperform

    57
    Days
    $0.26$5.91B

    -------------

    DAL(Delta Airlines)

    Market Cap: $35.84B (Large Cap)
    Market Beta: 1.01 (Low Market Risk)
    MetricDALPercentileAnalysis
    1.43%59thSlightly Undervalued
    -0.01%43rdWeak Growth
    3.87%77thGreat Quality
    0.02%45thSlightly Bearish
    5.31%68thSlight Outperform

    71
    Days
    $1.32$10.78B

    -------------

    NUAN(Nuance)

    Market Cap: $4.99B (Mid Cap)
    Market Beta: 1.11 (Average Market Risk)
    MetricNUANPercentileAnalysis
    -3.15%27thSlightly Overvalued
    -1.96%21stNegative Growth
    3.78%75thGood Quality
    -4.37%12thModerately Bearish
    -5.70%23rdModerate Underperform

    -5
    Days
    $0.10$482.18M

    -------------

    QCOM(Qualcomm)

    MetricQCOMPercentileAnalysis
    -0.97%41stSlightly Overvalued
    -0.50%36thWeak Growth
    -3.13%22ndBad Quality
    1.26%61stSlightly Bullish
    -3.34%31stSlight Underperform
    71
    Days
    $0.82$5.81B

    --------------

    AAPL(Apple)

    Market Cap: $724.74B (Mega Cap)
    Market Beta: 0.85 (Low Market Risk)
    MetricAAPLPercentileAnalysis
    -0.99%40thSlightly Overvalued
    5.91%96thStrong Growth
    5.11%89thGreat Quality
    1.82%68thSlightly Bullish
    11.85%92ndStrong Outperform

    77
    Days
    $1.74$48.07B

    -------------

    F(Ford)

    Market Cap: $61.74B (Large Cap)
    Market Beta: 1.57 (High Market Risk)
    MetricFPercentileAnalysis
    7.69%93rdStrongly Undervalued
    -0.23%40thWeak Growth
    1.00%50thMediocre Quality
    0.68%53rdSlightly Bullish
    9.14%84thModerate Outperform

    72
    Days
    $0.38$35.65B

    -------------

    NXP

    Market Cap: $24.53B (Large Cap)
    Market Beta: 2.65 (Very High Market Risk)
    MetricNXPIPercentileAnalysis
    -5.28%18thModerately Overvalued
    6.37%97thStrong Growth
    6.55%97thExcellent Quality
    1.71%66thSlightly Bullish
    9.35%85thModerate Outperform

    71
    Days
    $1.24$1.51B


    -------------

    Top 50 ; 자체 지표로 value가 상당히 높다고 나온 상위 50개 종목인것 같습니다. 유료로 하면 screener같은것을 쓰게 해줄것 같습니다. 저는 Market Cap이 너무 작은 기업들은 valuation을 계산할 가치가 떨어진다고 생각합니다.


    Rank Company Ticker Total Value Growth Quality Smart Earnings
      Alpha Alpha Alpha Alpha Alpha Strength
    1 Net 1 Ueps Technologies Inc. UEPS 21.09% 8.41% 5.14% 3.83% 3.70%  
    2 Bassett Furniture Industries Inc. BSET 20.63% 4.29% 7.06% 5.05% 4.23%  
    3 Chipmos Technologies (BERMUDA) Ltd IMOS 20.00% 8.81% 0.80% 5.58% 4.81%  
    4 Global Brass And Copper Holdings Inc BRSS 19.23% 6.66% 2.93% 3.82% 5.83%  
    5 Shoe Carnival Inc. SCVL 18.27% 3.35% 3.28% 6.36% 5.28%  
    6 Valero Energy Corp. VLO 17.86% 10.25% 2.15% 4.15% 1.30%  
    7 Wal-Mart Stores Inc. WMT 17.79% 6.28% 1.54% 5.91% 4.06%  
    8 Spartan Stores Inc. SPTN 17.17% 5.47% 5.80% 4.12% 1.79%  
    9 Arch Capital Group Ltd ACGL 17.12% 6.86% 2.13% 1.39% 6.74%  
    10 Voya Financial Inc VOYA 17.00% 10.84% 1.95% 1.39% 2.83%  
    11 The Marcus Corporation MCS 16.79% 4.13% 2.19% 6.27% 4.20%  
    12 United Continental Holdings, Inc. UAL 16.79% 6.52% 4.75% 4.62% 0.89%  
    13 Lear Corp. LEA 16.67% 5.91% 4.49% 4.88% 1.39%  
    14 Infinity Property and Casualty Corp. IPCC 16.59% 8.53% 1.51% 1.83% 4.71%  
    15 Culp Inc. CFI 16.51% 1.89% 4.79% 7.00% 2.83%  
    16 Sanmina-SCI Corp. SANM 16.46% 9.38% 1.18% 1.67% 4.23%  
    17 Tsakos Energy Navigation Ltd TNP 16.17% 6.57% 5.63% -0.64% 4.61%  
    18 ZAGG Incorporated ZAGG 16.10% 2.74% 5.59% 4.04% 3.73%  
    19 Jabil Circuit Inc. JBL 16.02% 8.22% 3.11% 3.26% 1.43%  
    20 Midwestone Financial Group Inc MOFG 15.94% 4.75% 1.14% 3.12% 6.93%  
    21 Mainsource Financial Group Inc MSFG 15.92% 5.35% 1.62% 2.14% 6.80%  
    22 Big 5 Sporting Goods Corp BGFV 15.92% 7.07% 1.39% 4.76% 2.70%  
    23 Nova Measuring Instruments Ltd NVMI 15.69% 1.40% 1.97% 8.35% 3.96%  
    24 SkyWest Inc. SKYW 15.54% 6.43% 3.02% 1.86% 4.23%  
    25 Aetna Inc. AET 15.54% 4.61% 4.86% 2.98% 3.08%  
    26 Delphi Automotive Plc DLPH 15.40% 1.26% 4.44% 6.37% 3.33%  
    27 EchoStar Corp. SATS 15.28% 5.04% 1.75% 4.00% 4.48%  
    28 Ducommun Inc DCO 15.20% 7.25% 3.28% 2.61% 2.06%  
    29 Perfect World Co., Ltd. PWRD 15.12% 6.33% 0.09% 7.91% 0.79%  
    30 Enlink Midstream Llc ENLC 15.06% 4.72% 0.57% 1.23% 8.54%  
    31 AerCap Holdings N.V. AER 14.94% 5.22% 2.25% 4.62% 2.84%  
    32 Consolidated Edison Inc. ED 14.84% 8.43% 0.81% 4.80% 0.80%  
    33 AutoNation Inc. AN 14.67% 4.09% 2.62% 4.62% 3.34%  
    34 Flextronics International Ltd. FLEX 14.49% 6.03% 4.37% 2.66% 1.42%  
    35 Bravo Brio Restaurant Group, Inc. BBRG 14.31% 5.57% 0.86% 7.27% 0.61%  
    36 Endurance Specialty Holdings Ltd ENH 14.20% 8.20% 1.94% -0.23% 4.29%  
    37 Magna International Inc. MGA 14.10% 7.97% 2.28% 2.84% 1.01%  
    38 Superior Energy Services, Inc. SPN 14.05% 7.84% 0.20% 5.17% 0.84%  
    39 Huntington Ingalls Industries, Inc. HII 14.02% 1.84% 4.70% 3.90% 3.58%  
    40 United Online, Inc. UNTD 14.01% 0.02% 4.08% 5.47% 4.43%  
    41 Cai International Inc CAP 13.84% 9.49% 0.62% 1.29% 2.44%  
    42 Encore Wire Corp. WIRE 13.83% 2.55% 0.38% 5.07% 5.83%  
    43 Intel Corporation INTC 13.82% 3.09% 2.86% 7.41% 0.46%  
    44 K12, Inc. LRN 13.78% 7.65% 0.88% 3.22% 2.03%  
    45 Blount International Inc. BLT 13.77% 3.98% 1.83% 4.32% 3.64%  
    46 Science Applications International Corporation SAIC 13.73% 4.10% 3.81% -2.62% 8.44%  
    47 Federal Signal Corp. FSS 13.65% 5.00% 0.13% 4.56% 3.96%  
    48 Targa Resources Corp. TRGP 13.61% 8.21% 0.44% 1.64% 3.32%  
    49 Health Net, Inc. HNT 13.61% 3.36% 3.40% 5.85% 1.00%  
    50 Central Garden & Pet Co. CENT 13.60% 5.36% 2.47% 2.69% 3.08%  


    '경제이야기 > Stock' 카테고리의 다른 글

    Nuance, NUAN 추천  (0) 2015.05.31
    IRobot, IRBT  (0) 2015.05.31
    19 stocks to buy now - CNNMoney  (0) 2015.03.28
    Should You Consider Nuance Communications?  (0) 2015.03.24
    2015년 유가상승 가능성을 이용한 투자 idea  (0) 2015.03.23
    Posted by 쁘레드