경제이야기/Stock2015. 3. 13. 13:03

ECB양정완화에 따라 어디다 한번 묻어볼까 생각중.

그리스는 조용히 다시 위기로 가고 있는것 같고, 안탁깝게도 아무도 지켜봐주지 않고 있네요. 좀있으면 다시 부각되겠지?

엄청난 유로화 약세에 따라 독일을 중심으로 수출기업들은 주가가 날라다니고 있슴.(좋겠다)


Name▲SymbolLast priceMkt capVolumeAvg vol52wk high52wk lowEPSP/EBetaBeta(y)Cur Ratio
Dow Jones Greece Total...DWGCNDT566.7101350.38536.06
National Bank of Greece...NBG1.224.20B5.62M22.34M5.830.98-0.422.49
Vanguard FTSE Europe ETFVGK53.7912.21B1.17M61.8949.81-3.671.32
T. Rowe Price European...PRESX20.42
AIRBUS GROUP N.V.AIR62.0155,255.0062.4639.686
Bayerische Motoren...BMW118.5576.35B20,212.00119.8574.9€8.8813.34
Daimler AGDAI92.798.91B57,691.0093.11555.21€6.5114.24
Volkswagen AGVOW237.7113.99B2,391.00239148.775€22.0010.8
STMicroelectronics NV...STM9.168.69B1.90M2.47M106.270.1563.151.49


사상 최고의 초강세 달러화. 결국 미국 경제에는 부메랑이 되어 돌아올것이 때문에 쉬어안갈수 없을테고 연준은 쉽게 금리를 못올리게 될것 같음.

1년내 30-40%떨어진 유로화로 저렴해진 유럽여행이나 한번 다녀와야 할듯.


Markets at a Glance

Major Stock Indexes

12:28 AM EDT 3/13/2015
LASTCHANGE% CHG
DJIA17895.22259.831.47%
Nasdaq4893.2943.350.89%
S&P 5002065.9525.711.26%
Russell 20001236.6420.861.72%
Global Dow2506.680.680.03%
Japan: Nikkei 22519255.09263.981.39%
Stoxx Europe 600395.36-0.12-0.03%
UK: FTSE 1006761.0739.560.59%

DJIA

4:33 PM EDT 3/12/2015

18000
17900
17800
17700
17600
10a
11a
12p
1p
2p
3p
  • 1D
  • 5D
  • 3M
  • 6M
  • 1Y
  • 3Y

Currencies

12:27 AM EDT 3/13/2015
LAST(MID)CHANGE
Euro (EUR/USD)1.0612-0.0025
Yen (USD/JPY)121.480.19
Pound (GBP/USD)1.4867-0.0017
Australia $ (AUD/USD)0.7677-0.0030
Swiss Franc (USD/CHF)1.00430.0022
WSJ Dollar Index88.750.17

Futures

12:18 AM EDT 3/13/2015
LASTCHANGE% CHG
Crude Oil47.100.050.11%
Brent Crude57.420.140.24%
Gold1157.96.00.52%
Silver15.6050.0890.57%
E-mini DJIA17877110.06%
E-mini S&P 5002065.751.750.08%

Government Bonds

12:27 AM EDT 3/13/2015
PRICE CHGYIELD
U.S. 10 Year-1/322.123
German 10 Year0/320.213
Japan 10 Year-8/320.403


Posted by 쁘레드
IT이야기2015. 3. 13. 03:04
QCOM에게는 안좋은 소식이네요. MSM은 삼성에게 까이고, Modem은 Apple에게 까이면 주요 매출 소스가 없어지게 됩니다.
Intel도 매출은 늘릴수 있지만 순익은 별로 없을거라고 하고, 최고 승자는 역시 경쟁붙여서 좋은 가격으로 납품받는 슈퍼갑 Apple이 되겠네요.
Intel은 modem만으로 끝내지 않고 AP도 같이 팔려고 할꺼라는데, Apple것이 너무 좋아 쉽게 넘어가지는 않을것 같고, 다만 Apple칩을 Intel Fab에서 생산하는것은 가능할지 모르겠네요. 삼성 견제도 되고요.

기사에 포함된 supplier 그래픽이 너무 좋네요.


Source : http://seekingalpha.com/article/2995886-apple-selects-an-intel-modem-a-glimpse-of-the-future


Summary

  • The report that Apple has chosen an Intel modem for use in a future iPhone has encouraged Intel supporters.
  • However, modem sales do not represent a “foot in the door” for Intel to sell mobile SOCs to Apple.
  • Instead, it's an example of commodity chipmakers fighting for second tier supplier status to a major mobile device maker.

Venture Beat's report on March 10 that an Intel (NASDAQ:INTC) modem had been selected by Apple (NASDAQ:AAPL) for an upcoming iPhone targeted at emerging markets had Intel bulls salivating, but the celebration was short lived, after Intel lowered its guidance for the March quarter. The modem selection, if it goes through, does offer a glimpse of the future for Intel and Apple, but perhaps not the future Intel bulls have in mind.

Commodity Mentality

One of the things I've noticed in writing for SA for the past almost two years is that fans of Intel also tend to be fans of other large chipmakers, especially Qualcomm (NASDAQ:QCOM) and Nvidia (NASDAQ:NVDA). It's understandable in retrospect, since they share a common business model as commodity IC manufacturers. Writing in 2013, it struck me as odd, since it was apparent to me that the companies were on a collision course with business objectives that were ultimately mutually exclusive.

With the news that Apple had selected an Intel LTE modem rather than going with its long-time modem supplier Qualcomm, we witnessed just the sort of collision I had in mind. But the ramifications are greater than just the competition between Intel and Qualcomm.

The manufacture of systems on chip (SOCs) for mobile devices continues to shift from the commodity paradigm (Intel, Qualcomm, Nvidia) to the custom paradigm pioneered by Apple in the A4 SOC for the first iPad. More importantly for the commodity processor makers, consumer interest has continued to shift away from commodity PCs in favor of mobile devices. Intel's revised guidance for the March quarter was due primarily to declining PC sales, which Intel attributed to slower than expected business and XP refresh sales.

But PC sales have suffered for some time as a result of competition from mobile devices, and the increasing capability of mobile devices has many consumers and businesses thinking outside of the PC box. At the same time, Apple's success with the latest iPhone 6 and 6 Plus has made the custom paradigm dominant in the mobile device world. This has exerted a Darwinian survival pressure on commodity IC makers in general, and the industry has evolved in order to try to adapt to the new paradigm.

One of the features of this evolution has been considerable consolidation in the industry, with the Freescale/NPX merger being only the most recent. This was proudly highlighted in a chart by Intel CFO Stacy Smith for their annual Investor Meeting:

(click to enlarge)

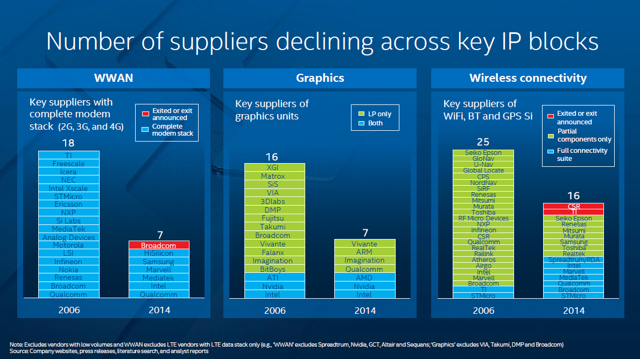
Intel's naiveté about what the chart truly portends is almost touching. One of the very important survival strategies for the commodity IC makers is to become a preferred supplier of one of the big mobile device makers such as Apple. Here, commodity ICs still have a role to play by supplying functionality that hasn't been incorporated into the SOC.

But it's a role that must get smaller with time, as more and more functionality becomes integrated into the SOC. Thus the decline in the number of suppliers highlighted in the Intel chart.

The shrinking role for secondary commodity ICs has been masked by a number of near-term effects, not the least of which is the sheer growth in the mobile device business since the advent of the iPhone. Another effect has been the incorporation of greater functionality into smartphones themselves, which has often mandated accessory ICs for things such as motion sensors and communications devices such as the NFC radios incorporated into iPhone 6 to support Apple Pay.

The potential loss by Qualcomm of Apple's modem business brings into focus the ongoing pressure on commodity IC makers. The debut of Samsung's (OTC:SSNLF) Galaxy S6, which will use a Samsung custom SOC rather than a Qualcomm SOC provided the confirmation of the forward guidance provided by Qualcomm management in their fiscal 2015 Q1 earnings release:

Looking ahead, we have lowered our revenue outlook for our semiconductor business for the second half of the fiscal year and lowered our EPS expectations.

These changes are largely driven by the effects of:

  • A shift in share among OEMs at the premium tier, which has reduced our near-term opportunity for sales of our integrated Snapdragon processors and has skewed our product mix towards more modem chipsets in this tier (Apple iPhone 6 impact)

  • Expectations that our Snapdragon 810 processor will not be in the upcoming design cycle of a large customer's flagship device(Samsung Galaxy S6 impact)

  • Heightened competition in China (MediaTek, Rockchip, Spreadtrum, Intel)

Comments in bold parentheses are mine.

Qualcomm guided to effectively flat revenue for its fiscal 2015, based on the above listed effects. As the progenitor of the custom SOC paradigm shift, and the most successful, Apple has pushed Qualcomm into second-tier status as an accessory IC supplier, and forced the competition with Intel. This is not a big win for Intel. Intel wants to be the SOC supplier for the mobile devices of the world, just as it has been the CPU supplier for the PCs of the world. This is the Intel business model that so many still believe in.

Winning on Performance and Cost?

Those who believe in the continuing viability of this business model must assume that Apple will eventually choose Intel for its mobile devices for the same reasons it chose Intel for its personal computers: superiority in performance and cost.

This is an argument by analogy that doesn't hold up under close scrutiny. The superiority in performance and cost of x86 over PowerPC was a direct consequence of the small scale of PowerPC production. The revenue generated by PowerPC was never large enough to allow the manufacturers, IBM (NYSE:IBM) and Motorola, to keep up with Intel either in processor design or in manufacturing.

Apple had entered into the PowerPC alliance in the hope of developing a superior processing architecture to Intel. When it became clear that the PowerPC alliance had failed in that key objective, Apple had no choice but to switch to Intel.

In Intel vs. ARM, the tables have been turned, with the benefits of economies of scale favoring ARM architecture devices. Furthermore, the fabless model prevalent in the ARM world demonstrates that it's not necessary for fabless semiconductor makers to own the means of production. The ARM foundries can spread the benefits of production scale across multiple customers.

The success of the fabless model has enabled Apple to produce its own SOCs without significant cost penalty relative to commodity makers such as Qualcomm or even Intel. Although not everyone has accepted my assertionthat Intel Architecture is significantly cost-disadvantaged relative to ARM, I've not seen anyone assert that Intel can offer a cost advantage without some form of marketing subsidy.

So if Intel cannot offer a cost advantage to Apple, can it at least offer a performance advantage? I wouldn't completely rule this out, since it depends on the resourcefulness and creativity of the systems designers at Intel, which I wouldn't want to minimize. However, I think this is a low probability shot, for a number of reasons.

Intel's performance advantage as a result of manufacturing is likely to be short lived. Certainly, Apple's A8x has been demonstrated to be superior to Bay Trail fabricated on Intel's 22 nm process. Even as Intel began fabricating Cherry Trail (now Atom X5, X7) on its more advanced 14 nm process, Samsung was in production on its own Exynos SOCs, and probably Apple's next generation A-series, on 14 nm FinFET as well.

On the processor design front, Apple has demonstrated that it has a very talented design staff, along with the advantage of using a more modern and efficient CPU architecture in ARM. I doubt that there is any design advantage that Intel can achieve that Apple will not match with its own innovations.

Even if Intel could show some marginal performance advantage for Atom X5-7 compared to Apple's next A-series, Apple would still be reluctant to make a switch. The final advantage that Apple derives from its custom SOCs is that they're... custom. Customization allows Apple to tailor the SOC to the needs of the device. The better integration and efficiency afforded by SOC customization is part of what makes Apple mobile devices work so well. This is perhaps the most important consideration. Apple's custom SOCs give it an important discriminator in the highly competitive mobile device market.

Regardless of whom Apple chooses for its modem supplier, the winner will not be Intel, or Qualcomm, but Apple. Apple will get the best possible product at the lowest possible price, with suppliers falling all over themselves to get and keep Apple's business.

Posted by 쁘레드
사진(기) 이야기2015. 3. 11. 11:19

년초에 한국사람이라면 높은 산에 올라가서 멀리 내다보며 신년 계획을 하는것이 맞지만, 저는 미국에서 가장 낮은 곳으로 갔습니다. 85.5m below sea level @ death valley.

모든 사람이 남들보다 높아지려고 할때 더욱 낮은자리로 가서 행복하게 살고 싶다고 다시 다짐했습니다. 저같은 사람도 있어야 traffic이 좀 덜하겠지요?


Posted by 쁘레드
추천영화드라마2015. 3. 11. 11:17


어제 저녁에 세인이를 제우고 Nexflix를 넘기다가 Gu Family Book이라는 제목을 보고 눌러보았습니다. 언뜻들었던 구가의서구나 하는 느낌으로. 3개를 넘겨봐도 이건 별로인데 왜 인기가 많았을까 하는 찰라, 수지가 뛰어가다가 긴머리가 휘날리며 slow video되는것이 아닌가...


4편부터 몰입해서 보고 있습니다. 구가의 서를 엔하위키에서 찾아보니 저처럼 아저씨 팬들이 4편부터 몰빵해서 봤는지 시청률이 고공행진했다고 나오네요.

수지는 왤케 매력적인지 모르겠네요. 하나하나 뜯어보면 안예쁜데... ^^ 미국에서라도 수지 팬클럽에 가입해야겠습니다.


PS:이승기 발연기 이 드라마와 안 어울리더란. ㅋㅋㅋ

'추천영화드라마' 카테고리의 다른 글

바람의 검심 영화 실사판 강추  (0) 2015.03.16
우아한 거짓말  (0) 2015.03.15
한공주  (0) 2015.03.14
명량을 보고  (0) 2014.08.19
Love Affair 1994  (0) 2009.09.17
Posted by 쁘레드
경제이야기/Stock2015. 3. 9. 10:59

세인이 친구아빠로 부터 BioTech투자에 대한 조언을 들었습니다. 요즘 인수합병이 가장 HOT한 분야가 BioTech이지요. 이쪽 이야기는 들어도 잘 몰라서 조언을 필요했는데, 자기가 관심같고 있는 회사와 제 취향에 맞는 회사까지 두루두루 좋은 설명과 함께 좋은 설명을 들었습니다. 좀 조사하고 공부하고 tracking을 해야겠네요.


NameSymbolLast priceChangeMkt capVolumeAvg vol52wk high52wk lowEPSP/EBetaBeta(y)Cur ratio
ISIS Pharmaceuticals...ISIS70.44-1.32 (-1.84%)8.38B3.28M3.03M75.2422.25-0.33na1.531.097.25
Juno Therapeutics IncJUNO52.840.81 (1.56%)4.78B1.27M1.26M61.7034.71-2.24nanana3.25
Regulus Therapeutics IncRGLS20.7-0.43 (-2.04%)1.05B1.14M784,796.0025.605.40-1.27nana1.004.69
Gilead Sciences, Inc.GILD101.81-1.61 (-1.55%)151.64B8.66M12.60M116.8363.507.3713.820.710.833.08
Vertex Pharmaceuticals...VRTX126.34-0.62 (-0.49%)30.59B1.58M1.60M127.6959.79-3.12na0.32-0.704.20
Amgen, Inc.AMGN154.88-4.72 (-2.96%)117.53B4.09M3.53M173.14108.206.7023.120.570.584.95
Illumina, Inc.ILMN193.14-6.99 (-3.49%)27.77B1.10M1.07M213.33127.692.3881.300.800.492.62
Pfizer Inc.PFE33.97-0.50 (-1.45%)208.20B39.92M31.04M34.9727.511.4223.960.740.892.67


Posted by 쁘레드
경제이야기/Stock2015. 3. 9. 10:38


Div Yield Order
Company nameSymbolLast priceMarket capP/E ratioDiv yield (%)52w price change (%)Current ratioCash/shareReturn on assets (5 yr avg) (%)EBITDA margin (%)
Royal Dutch Shell plc (ADR)RDS.A61.04200.97B12.86.16-15.961.166.896.511.44
Telefonica S.A. (ADR)TEF14.7470.44B14.075.94-6.6512.95.5333.11
LUKOIL (ADR)LUKOY46.2638.77B7.545.66-12.11.64.298.8112.27
CNOOC Ltd (ADR)CEO138.9663.02B75.29-14.51.1432.7815.1148.75
ConocoPhillipsCOP62.7977.32B13.624.65-5.421.314.115.7231.4
Verizon Communications Inc.VZ48.29196.65B19.184.561.751.062.685.6428.35
Chevron CorporationCVX103.55194.69B10.224.13-9.841.327.0310.3420.19
Canon Inc (ADR)CAJ33.0744.15B17.424.047.472.66.956.1416.82
BASF SE (ADR)BASFY95.3387.94B15.43.93-15.161.732.058.913.58
Seagate Technology PLCSTX56.918.68B9.433.813.572.418.1318.618.37
Caterpillar Inc.CAT80.0648.53B13.653.5-17.971.3912.115.3715.25
Syngenta AG (ADR)SYT67.0931.48B19.073.48-11.221.723.578.7819.33
Enersis SA (ADR)ENI15.615.53B15.693.4810.721.232.937.1831.39
Siemens AG (ADR)SIEGY107.8590.62B16.513.48-18.521.3113.085.0111.55
SKY PLC (ADR)SKYAY60.1525.94B10.733.33-4.371.025.31617.83
Emerson Electric Co.EMR56.5638.76B17.943.32-13.051.294.529.2220.46
LyondellBasell Industries NVLYB87.441.70B10.933.2-4.022.145.3918.614.84
Merck & Co., Inc.MRK56.84161.32B13.883.17-0.731.775.545.7153.2
China Mobile Ltd. (ADR)CHL64.36267.61B14.113.1634.361.2616.6813.5236.36
CA, Inc.CA31.713.83B18.653.15-4.521.167.417.2736.83
Per Order
Company nameSymbolLast priceMarket capP/E ratioDiv yield (%)52w price change (%)Current ratioCash/shareReturn on assets (5 yr avg) (%)EBITDA margin (%)
CNOOC Ltd (ADR)CEO138.9663.02B75.29-14.51.1432.7815.1148.75
LUKOIL (ADR)LUKOY46.2638.77B7.545.66-12.11.64.298.8112.27
Seagate Technology PLCSTX56.918.68B9.433.813.572.418.1318.618.37
Chevron CorporationCVX103.55194.69B10.224.13-9.841.327.0310.3420.19
SKY PLC (ADR)SKYAY60.1525.94B10.733.33-4.371.025.31617.83
LyondellBasell Industries NVLYB87.441.70B10.933.2-4.022.145.3918.614.84
Royal Dutch Shell plc (ADR)RDS.A61.04200.97B12.86.16-15.961.166.896.511.44
ConocoPhillipsCOP62.7977.32B13.624.65-5.421.314.115.7231.4
Caterpillar Inc.CAT80.0648.53B13.653.5-17.971.3912.115.3715.25
Merck & Co., Inc.MRK56.84161.32B13.883.17-0.731.775.545.7153.2
Telefonica S.A. (ADR)TEF14.7470.44B14.075.94-6.6512.95.5333.11
China Mobile Ltd. (ADR)CHL64.36267.61B14.113.1634.361.2616.6813.5236.36
BASF SE (ADR)BASFY95.3387.94B15.43.93-15.161.732.058.913.58
Enersis SA (ADR)ENI15.615.53B15.693.4810.721.232.937.1831.39
Siemens AG (ADR)SIEGY107.8590.62B16.513.48-18.521.3113.085.0111.55
Canon Inc (ADR)CAJ33.0744.15B17.424.047.472.66.956.1416.82
Lockheed Martin CorporationLMT197.6662.38B17.633.0418.471.114.617.9314.7
Emerson Electric Co.EMR56.5638.76B17.943.32-13.051.294.529.2220.46
CA, Inc.CA31.7113.83B18.653.15-4.521.167.417.2736.83
Baxter International Inc.BAX67.7336.75B19.053.070.241.715.399.625.96
Market Cap Order
Company nameSymbolLast priceMarket capP/E ratioDiv yield (%)52w price change (%)Current ratioCash/shareReturn on assets (5 yr avg) (%)EBITDA margin (%)
China Mobile Ltd. (ADR)CHL64.36267.61B14.113.1634.361.2616.6813.5236.36
Royal Dutch Shell plc (ADR)RDS.A61.04200.97B12.86.16-15.961.166.896.511.44
Verizon Communications Inc.VZ48.29196.65B19.184.561.751.062.685.6428.35
Chevron CorporationCVX103.55194.69B10.224.13-9.841.327.0310.3420.19
Merck & Co., Inc.MRK56.84161.32B13.883.17-0.731.775.545.7153.2
Siemens AG (ADR)SIEGY107.8590.62B16.513.48-18.521.3113.085.0111.55
BASF SE (ADR)BASFY95.3387.94B15.43.93-15.161.732.058.913.58
ConocoPhillipsCOP62.7977.32B13.624.65-5.421.314.115.7231.4
Telefonica S.A. (ADR)TEF14.7470.44B14.075.94-6.6512.95.5333.11
CNOOC Ltd (ADR)CEO138.9663.02B75.29-14.51.1432.7815.1148.75
Lockheed Martin CorporationLMT197.6662.38B17.633.0418.471.114.617.9314.7
Caterpillar Inc.CAT80.0648.53B13.653.5-17.971.3912.115.3715.25
Canon Inc (ADR)CAJ33.0744.15B17.424.047.472.66.956.1416.82
LyondellBasell Industries NVLYB87.441.70B10.933.2-4.022.145.3918.614.84
LUKOIL (ADR)LUKOY46.2638.77B7.545.66-12.11.64.298.8112.27
Emerson Electric Co.EMR56.5638.76B17.943.32-13.051.294.529.2220.46
Baxter International Inc.BAX67.7336.75B19.053.070.241.715.399.625.96
Syngenta AG (ADR)SYT67.0931.48B19.073.48-11.221.723.578.7819.33
SKY PLC (ADR)SKYAY60.1525.94B10.733.33-4.371.025.31617.83
Telekomunikasi Indns (ADR)TLK45.3523.19B19.863.0813.531.163.3816.4252.13


Posted by 쁘레드
경제이야기2015. 3. 8. 08:18

3/5일 드리 기자회견 내용 요약


3/9(월)부터 국채매입 시작, 매월 600억 EURO 매입.

잔존만기 발행잔액에 비례해서 매입

최저 매입 수익률은 -0.20% same as ECB 초과지준 예치금 금리

유로화 평가절하와 2% 인플레이션까지 올리는것이 목표

유로존 수출회복, 소비회복을 기대


------------

  1. 그리스것은 정말 8월부터 살수 있을까. 그리스가 기존 부채를 상환해야할텐데 돈이 없는데, 어디서 빌리며 누가 꿔주려고 할까? 러시아 중국없이 가능할까?
  2. 매달 600억 유로를 다 못채우면 남은 돈은 어떻게 될까
  3. 채권금리는 계속 떨어질텐데, 주식시장은 어떤 주식이 QE의 효과를 받을까. 자산가치가 올라간다고 생각하면 유럽 부동산이 직접 수혜자가 아닐지. 유로화 가치는 떨어지고 수출주는 효과가 있을텐데, 미국에서 달러로 투자하는 것은 결국 주가 10%상승 유로화 10% 하락으로 상쇄되는것이 아닐지.
  4. 그리스, 스페인 처럼 완전 junk말고 junk에 가까우면서 ECB 국채매입의 효과가 바로 들어날 나라를 찾아 그 나라관련 주에 투자하는게 좋을듯
  5. 미국의 금리인상은 어떤 영향을 줄까?
  6. 그리스가 다시 배째자고 나온다면?
아래는 ETF와 Mutual Fund 추천

Morningstar european funds list
http://news.morningstar.com/fund-category-returns/europe-stock/$FOCA$ES.aspx
Category NameTicker1 Month(%)YTD(%)3 Month(%)1 Year(%)3 Year(%)5 Year(%)
Europe Stock2.254.691.08-6.2811.267.80
JPMorgan Intrepid European InstJFEIX2.383.88-0.53-8.7815.589.94
JPMorgan Intrepid European SelJFESX2.373.83-0.60-8.9515.339.68
JPMorgan Intrepid European AVEUAX2.323.76-0.68-9.2215.019.41
JPMorgan Intrepid European A LWVEUAX.LW2.323.76-0.68-9.2215.019.41
T. Rowe Price European StockPRESX1.324.131.24-6.3414.5410.61
JPMorgan Intrepid European CVEUCX2.313.67-0.75-9.6214.478.87
JPMorgan Intrepid European BVEUBX2.283.68-0.81-9.6814.448.86
Putnam Europe Equity YPEUYX3.475.741.65-5.1114.409.65
Putnam Europe Equity APEUGX3.445.721.60-5.3314.129.39

--------------

https://personal.vanguard.com/us/funds/snapshot?FundId=0963&FundIntExt=INT

VANGUARD FTSE EUROPE ETF (VGK) 

Open54.92
Previous Close55.47
52 - Week Range49.81 - 61.89
10/16/14 - 6/19/14
Avg Volume 
(10 days)
5,072,708
Market Cap 
12.5 B
Shares Outstanding 
228.8 M
Yield 
4.45%
Quarterly Dividend 
0.291
Ex-Dividend Date 
12/22/14
Dividend Payable Date12/29/14
Morningstar Rating as of 2/28/2015
 Overall 21 Funds
 3 Year 10 Funds
 5 Year 9 Funds
-- 10 Year 5 Funds
Strategy
The investment seeks to track the performance of a benchmark index that measures the investment return of stocks issued by companies located in the major markets of Europe. The fund employs an indexing investment approach by investing all, or substantially all, of its assets in the common stocks included in the FTSE Developed Europe Index. The index is made up of approximately 521 common stocks of companies located in 16 European countries-mostly companies in the United Kingdom, Switzerland, France, and Germany (which made up approximately 32.6%, 14.1%, 13.9%, and 13.3%, respectively, of the index's market capitalization as of October 31, 2014).
VGK Overview
CategoryEurope Stock
Expense Ratio 
0.12%
Net Asset Value 
 

(as of 3/5/2015)
$55.42
Premium / Discount 
(as of 3/5/2015)
0.09%
Total Net Assets 
12.7 B
Inception Date3/4/2005
AVERAGE ANNUAL RETURNS
Quarter-End Month-End

 1 Year3 Year5 YearSince
Inception
3/4/2005
VGK Market Value-7.10%+11.99%+5.65%+4.40%
VGK Net Asset Value-6.56%+12.20%+5.60%+4.43%
MSCI ACWI Ex USA NR USD-3.87%+8.99%+4.43%+4.81%
as of 12/31/2014


------------------

T. ROWE PRICE EUROPEAN STOCK PRESX

Net Asset ValueToday’s ChangePublic Offer PricePrevious CloseTrade
 20.67-0.310 (-1.48%)20.6720.98  
NASDAQ as of  8:00 PM ET 3/6/15
 
Morningstar Rating as of 2/28/2015
 Overall 114 Funds
 3 Year 83 Funds
 5 Year 77 Funds
 10 Year 64 Funds
Category:   Europe Stock
Fund Characteristic:   Index Fund
The investment seeks long-term growth of capital through investments primarily in the common stocks of companies located (or with primary operations) in Europe. The fund will normally invest at least 80% of its net assets (including any borrowings for investment purposes) in European companies. Under normal conditions, at least five countries will be represented in the fund's portfolio. It may purchase the stocks of companies of any size. The fund seeks to purchase the stocks of companies with quality management and strong cash flows, and does not emphasize either a growth or value bias in selecting investments.
Growth of $10,000
This graph represents the past growth of an investment of $10,000. The performance represented is past performance and is not intended to imply any future performance of the fund. It assumes reinvestment of dividends and capital gains, and does not reflect sales loads, redemption fees or the effects of taxes on any capital gains and/or distributions. The index is used for comparative purposes. Indexes are unmanaged and cannot be invested into directly.
FUND DETAILS
Net Expense Ratio ** 
0.96%
Gross Expense Ratio 
0.96%
Total Net Assets 
$1.4 B
Fund Inception2/28/90
Order Cut-off Time4:00PM ET
AvailabilityOpen To New Investors
Initial Investment$2,500
Addl. Investment$100
Initial IRA$1,000
Additional IRA$100
Transaction Fee 
Sales Charge 
None
Fund Redemption
Fee
 
2.00%
90 Days
as of 2/28/2015
AVERAGE ANNUAL RETURNS
Quarter-End Month-End
 1 Year3 Year5 Year10 Year
PRESX-5.90%+16.24%+9.15%+6.91%
Category-7.30%+12.86%+6.48%+5.75%
Index-3.87%+8.99%+4.43%+5.13%
as of 12/31/2014
TOP HOLDINGS
4.25%   Nestle SA
2.65%   Allianz SE
2.35%   Intesa Sanpaolo
2.32%   Royal Dutch Shell PLC Class...
2.19%   Wirecard AG
 Top 5 holdings total 13.76%
as of 12/31/2014


--------------------------


Posted by 쁘레드
경제이야기2015. 3. 8. 08:10

정부가 발표하는 한국의 실업률이 실제 체감률을 잘 못반영하는 통계수치의 한계가 있는것은 어쩔수 었다고 치는데. 3%에서 4%까지 급격히 증가하고 있네요. 청년실업률은 어느세 9%넘어 10%에 가까워지고 있는 추세니 한국 젊은이들이 얼마나 어려운 생활을 격고 있을까 걱정됩니다.


추적60분에서 열정페이에 관한 내용이 나오던데, 자본주의 사회에서 적은돈으로 좋은 노동력을 굴려보고 싶은 욕구는 이해가지만 단순노동을 시키면서 사회의 최저임금도 안줄려고 하는 사람들이 자본주의를 말할 자격이 없다고 생각합니다. 그런 천민자본주의를 배운 기업가가 한국에는 많은것 같습니다.


실제로 열정페이는 얼마간 돈안받고 일하더라도 스스로 독립하거나 좋은 경력을 쌓을때나 가능한 이야기지요. 수요가 넘쳐난다는 이유로 노예로 부리는 것을 막기위한 것이 최저임금이지요. 편의점에서 조차 편의점에서 조차 최저임금을 안주려한다니... 노동부와 인권위가 좀더 자기 역할을 해야할것 같네요.

 200920102011201220132014
08월
2014
09월
2014
10월
2014
11월
2014
12월
2015
01월
아래위원상태펼침아래위원상태펼침아래위원상태펼침아래위원상태펼침아래위원상태펼침아래위원상태펼침아래위원상태펼침아래위원상태펼침아래위원상태펼침아래위원상태펼침아래위원상태펼침
취업자 증감-7.232.341.543.738.659.445.140.643.842.234.7
- 농림어업-3.8-8.2-2.5-1.4-0.8-12.5-12.8-14.6-8.5-9.4-10.4
- 제조업-12.619.16.31.47.921.917.314.210.214.214.1
- 건설업-9.13.3-0.22.2-1.96.45.14.78.48.37.0
- 서비스업17.920.038.641.633.245.336.737.234.529.224.2
실업자88.992.085.582.080.789.084.985.881.888.698.8
실업률(%)3.63.73.43.23.13.33.23.23.13.43.8
청년실업자34.734.032.031.333.136.435.833.633.238.139.5
청년실업률(%)8.18.07.67.58.08.48.58.07.99.09.2


이런 사이트가 있었네요. 한국도 통계자료를 잘 왜곡하지 말고 잘 유지했으면 좋겠습니다.

http://www.index.go.kr/potal/main/EachDtlPageDetail.do?idx_cd=1063


Posted by 쁘레드
경제이야기2015. 3. 8. 08:00

1. 성장률 목표 7.0%

필요하고 가능한 목표로 정의. 실제적으로 6%대로 떨어질 가능성이 높은데, 정부가 7%까지는 만들려고 할거라는 선언인듯. 중국의 경제가 급속도록 식고있는것은 사실인듯. 내수부양과 자연보고, 분배등으로 잘 이어지면 좋은 나라될듯.


2. 소비자 물가 목표 3.0%

3.5%에너 3.0%로 낮쳐졌지만, 실제적인 성장율이 6%대일텐데 3%은 좀 높은것 같다는 생각이 듬.


3. 재정적자 목표 2.3%

지난해 2.1%에서 약간 상향했는데, 떨어지는 성장을 잡으려면 국가가 좀더 풀어야 할것 같은데, 중국 지도부는 미국식 무식하게 돈푸는것에 상당히 거부감이 있어 보임. 경제대국 답지는 않은것 같지만, 미국과 같은 달러화 지위도 없고 개인적으로 잘하는 거라 생각됨.


4. 일자리 추가 1000만명.

인구를 생각하면 이정도로 될가 생각도 듭니다.

현재 실업률이 궁금한데 도시 실업률 목표가 4.5% 라고 함.


Posted by 쁘레드
자동차이야기2015. 3. 8. 07:04

미국 2015년 2월 자동차 판매량

SUV And Crossover Sales Rankings

Click Column Headers To Sort • January 2015 • February 2014

RankSUV/CrossoverFebruary 2015 YTDFebruary 2014 YTD%
Change
February
2015
February
2014
% Change
#1Honda CR-V45,50938,99116.7%22,29820,7597.4%
#2Toyota RAV441,76733,33125.3%21,94316,45133.4%
#3Chevrolet Equinox41,27836,13414.2%21,72321,5870.6%
#4Ford Escape40,96942,604-3.8%20,91523,145-9.6%
#5Nissan Rogue37,06831,02819.5%21,41917,19724.6%
#6Ford Explorer35,64926,73433.3%18,61313,92433.7%

Passenger Car Sales

Click Column Headers To Sort • January 2015 • February 2014

RankCarFebruary 2015February 2014%
Change
February
2015
February
2014
% Change
#1Toyota Camry59,70552,33014.1%32,94228,99813.6%
#2Toyota Corolla55,19648,05214.9%27,83925,29910.0%
#3Nissan Altima54,88253,3642.8%28,47430,849-7.7%
#4Honda Accord42,62745,226-5.7%21,61624,622-12.2%
#5Ford Fusion42,42644,615-4.9%22,73223,898-4.9%
#6Honda Civic39,73743,399-8.4%21,03821,575-2.5%
#7Chevrolet Cruze36,99438,664-4.3%18,30121,836-16.2%
#8Ford Focus32,49727,92916.4%14,01915,926-12.0%
#9Chrysler 20029,96222,95830.5%15,80512,04631.2%
#10Nissan Sentra29,74921,46638.6%15,35412,33924.4%
#11Hyundai Elantra27,94831,719-11.9%15,70816,393-4.2%
#12Hyundai Sonata26,35021,00525.4%13,98711,19025.0%


Pickup Trucks

Click Column Headers To Sort • January 2015 • February 2014

RankBest-Selling TruckFebruary
2015
February
2014
%
Change
2015
YTD
2014
YTD
%
Change
#1
55,236
55,882-1.2%109,606102,4187.0%
#2
45,395
36,58424.1%81,50165,51024.4%
#331,29829,3036.8%59,91654,37410.2%
#4
15,157
14,2326.5%27,77825,3509.6%
#5
12,372
10,94213.1%23,78120,78414.4%
#6
9052
792314.2%17,24915,8139.1%
#7
6563
1656,200%12,5051583,266%


U.S. Vehicle Sales Rankings

Click Column Headers To Sort • January 2015 • February 2014

RankVehicleFebruary 2015 YTDFebruary 2014 YTD%
Change
2015 YTD2014 YTD% Change
#1Ford F-Series109,606102,4187.0%55,23655,882-1.2%
#2Chevrolet Silverado81,50165,51024.4%45,39536,58424.1%
#3Ram P/U59,91654,37410.2%31,29829,3036.8%
#4Toyota Camry59,70552,33014.1%32,94228,99813.6%
#5Toyota Corolla55,19648,05214.9%27,83925,29910.0%
#6Nissan Altima54,88253,3642.8%28,47430,849-7.7%
#7Honda CR-V45,50938,99116.7%22,29820,7597.4%
#8Honda Accord42,62745,226-5.7%21,61624,622-12.2%
#9Ford Fusion42,42644,615-4.9%22,73223,898-4.9%


USA Auto Sales Brand Rankings

January 2015 • February 2014 • Updated at 3:53 PM AT on 03.03.2015

RankAutomaker
February
2015
 ▴
%
Change
2015
YTD
%
Change
February
2015
Market
Share
YTD
Market
Share
#1
Ford
173,509
-1.8%
344,331
6.2%
13.8%
14.3%
#2
159,788
3.8%
302,670
10.9%
12.7%
12.6%
#3
153,608
13.0%
295,981
13.6%
12.2%
12.3%
#4
106,777
1.1%
201,226
7.5%
8.5%
8.3%
#5
92,474
4.1%
182,676
7.7%
7.3%
7.6%
#6
55,642
21.0%
107,165
22.0%
4.4%
4.4%
#7
52,505
7.1%
97,010
4.3%
4.2%
4.0%
#8
44,030
6.8%
82,329
5.2%
3.5%
3.4%
#9
42,433
19.3%
78,104
23.4%
3.4%
3.2%
#10
42,115
-15.3%
77,462
-8.5%
3.3%
3.2%


Posted by 쁘레드