IT이야기2015. 8. 12. 18:41

거실PC를 시작으로 집에 있는 PC/노트북을 Windows 10으로 upgrade하고 있습니다. 첫 인상은 아주 잘 만든것 같습니다. Windows 10을 공짜로 풀고 있지만 어떻게 수익이 날수 있을까를 생각중이고 MS주가를 눈여겨 보고 있습니다.


윈도우10용 노트북이 어떤것이 좋을까 하는 비디오가 경제뉴스 사이트에 하나 올라왔길래 봐봤습니다.

Dell XPS 13을 최고로 꼽고 있습니다. 디자인도 예쁘고, 키보드와 트랙패드, 성능도 좋아야하고 배터리 라이프도 봤다고 합니다. 맥북이나 맥북에어는 이 면에서 최고라고 하네요. 그런데 여자분이 IT쪽 geek이 아니라 몇가지에서 그냥 웃었습니다. 최소한 $600은 넘는것을 사라는데서 그냥 웃습니다.

----------------


----------------


Posted by 쁘레드
IT이야기2015. 7. 14. 00:50

저는 애플 주주일뿐 애플제품은 비싸서 살수 없는 가난한 사람이며 애플빠는 아니다는 점을 다시 한번 강조하고 시작합니다. 제 현재 핸드폰은 노트4이며 거의 공짜로 2년계약으로 샀습니다.(애플빠는 아니지만, 애플이 만드는 세상에는 항상 감사하고 삽니다)


정말 10년간 애플의 행보는 믿어지지 않는 일의 연속이네요. 삼성과 애플이 합쳐서 스마트폰 시장 영업이익의 90%를 넘게 차지하던 때도 있었는데, 이제는 삼성은 15%로 폭락했고, 애플이 혼자 92%를 차지하게 됐습니다. 이 결과는 대화면으로 대표되는 아이폰 6가 대히트를 친것과 삼성의 하이엔드 역영까지 다 가져갔기때문에 가능한 결과인것 같습니다. 애플과 삼성의 합은 107%입니다.


결국 하이엔드, 비싸고 좋은 핸드폰은 아이폰 하나이고, 다른 핸드폰은 중저가로 만들어 버린것 같습니다. 너희들끼리 레드오션에서 경쟁해~


http://www.wsj.com/articles/apples-share-of-smartphone-industrys-profits-soars-to-92-1436727458?mod=trending_now_3

------------------

더욱 놀라운 것은 아이폰6가 7000-8000만대 팔았다면 이번 가을에 발표될 Iphone6S는 8500-9000만대로 20% 정도 더 팔릴것으로 보고 있다고 합니다. 이것이 경쟁자들을 흔들어 놓기위한 작전인지, 실제로 예상하는지 알수는 없지만, 삼성은 이럴 저지하기 위해 갤럭시 S6 마케팅비를 올리고 가격을 낮추고 있으며, 심지어 아이폰과 판매량에서 경쟁 상대도 아닌 노트5를 한달빨리 조기 등판한다고 발표하고 있습니다. 작전이라고 내놓고 있지만 결국 완전 작전에 말리고 있는거지요.


그렇다고 많이 못판다는 생각하는 것은 아닙니다. 2년전 Iphone5가 대히트친것을 생각하면 2년이 지나 교체수요가 이미 어마어마하게 시장에 대기하고 있습니다. 이미 안드로이드에서 하이엔드는 다 죽었다고 해도 될정도로 비싼 안드로이드가 망가진 시장까지 가만하면 9000만대를 목표로 해도 충분하다고 생각됩니다.


애플의 주가는 어떻게 될까요? 계산기좀 두드려봐야겠네요. 현재주가도 여전히 너무 낮다고 생각됩니다. 거져 용돈벌수 있는 기회가 또 오네요. 주가 예상은 다음번 글에서 정리하겠습니다.

http://www.wsj.com/articles/apple-preparing-record-number-of-new-iphones-1436367371


Posted by 쁘레드
IT이야기2015. 7. 8. 14:54

뒷떨어진 공정, 설계, 성능, 가격 뭐하나 좋은게 없는 상태로 너무 오래동안 지속되어 왔네요. 작년처럼 Windows XP지원종료에 따른 PC교체수요도 없고, 심지어 새로나올 Windows 10은 저사양 PC에서도 잘 돌아갈거라는 비보가. 예상대로 실적도 안좋고 전망도 안좋게 발표했네요. 장중에 20%가까이 급락하다 15%급락으로 마무리. Market Cap 이 $1.63B로 정말 껌값. 중국업체도 아직 입질이 없는걸 보면 아무것도 남은게 없는가 하는 생각도 듭니다.

AMD는 이번년에 인수되지 못하면 결국 청산절차로 들어가야할것 같습니다. MS가 미친척하고 사주면 얼마나 좋을까요. MS의 자본력으로 밀어붙이면 죽어가던 AMD도 살수 있을것 같은데요.


------------------

Intel is sucking the life out of AMD

By Matt Krantz July 7, 2015 12:10 pm

AP

Remember the days when Advanced Micro Devices (AMD) was a viable rival to Intel (INTC)? Those days are long gone.

Forget about the fact for now shares of computer chipmaker AMD are down 38 cents, or 15%, to $2.09. Forget even the fast that 38 cents is 15% of the stock's value. And forget that the company warned last night that quarterly results would be weaker than expected.

You can blame soft PC sales. And that's partly true – and it's what AMD blamed saying weaker-than-expected consumer PC demand is hurting revenue and profitability.

But the real evidence of AMD's swift decline is clear in the massive dropoff compared with industry titan Intel, which continues to pull ahead. AMD's revenue has been headed in the wrong direction. AMD's revenue of $5.5 billion last year is essentially flat with 2012 and down 14% from 2010. And while Intel hasn't been exactly growing like wildfire, it's been steadily increasing revenue.

Chart source: S&P Capital IQ

But the gap between AMD and Intel gets even more vast when you compare them directly to one another. Back in 1990 – when AMD was offering legitimate competition to Intel, it had revenue that was more than a quarter of Intel's. That ratio climbed back to about 15% on AMD's resurgence in the mid 2000s.

Now, AMD's revenue is 9.9% of Intel's.

Chart source: S&P Capital IQ via Microsoft Excel

Things aren't looking much better going forward, according to a note to clients from Christopher Roland at FBR. The lure to buy a new PC with the latest version of Windows isn't the case – sinceMicrosoft (MSFT) has changed its strategy. Typically, new versions of Windows give PC makers a boost as consumers bought new machines – but that's not likely to be the case with Windows 10 since Microsoft is writing the software to run perfectly well on existing PCs. Windows 10 is also free upgrade to current Windows users. AMD is expected to lose an adjusted 37 cents a share this year.

"We do not think the market yet realizes the impact of Microsoft's new free Win10 upgrade strategy on PC units. Historically, consumers have overwhelmingly upgraded their PC operating systems through the purchase of new PC hardware. While this was our original outlook for the Win10 upgrade cycle, we recently reduced our 2H15 and 2016 PC outlook as Microsoft is offering consumers a free Win10 cloud upgrade for all Win 7 and 8.1 owners," Rolland says.

-----------------

ENLARGE

Shares of Advanced Micro Devices fell sharply after the chip maker estimated second-quarter revenue and gross margins below its earlier projections. PHOTO: ASHLEY PON/BLOOMBERG NEWS

The pain isn't over for Advanced Micro Devices.

The chip maker also known as AMD tumbled on Tuesday. The shares slid sharply after the company announced that second-quarter revenue and gross margins would fall short of its earlier projections. The shortfall was blamed on weak PC sales, along with a one-time charge for pushing more of its chip production to newer manufacturing technologies.

The fact that AMD has fallen short of Wall Street earnings targets in three of the preceding four quarters should have damped the surprise from Monday's announcement. But the company had issued a relatively bullish forecast for the year just two months earlier, calling for revenue in the year's second half to jump 15% from the first.

That projection—underpinned in part by hopes that PC sales will get a boost from the coming launch of Microsoft's Windows 10—looked aggressive then. It seems downright dicey now.

The result is that AMD may have to make more painful adjustments to its outlook when it reports full second-quarter results next week. And in the longer term, the company's potential remains hazy.

While AMD's position with gaming consoles remains strong, the PC market still accounts for about half of total revenue. AMD is seeking opportunities in areas such as data centers and connected devices. But it faces tough competition there from much larger rivals. Data centers are of particular interest to Intel, which spent more on R&D and marketing last quarter than AMD is expected to generate in total revenue this year.


Posted by 쁘레드
IT이야기2015. 6. 6. 01:35

빌 게이츠의 평가는 그가 마이크로소프트 CEO로 있을때보다 그가 그 자리를 박차고 나온 이후부터 더 좋아진것 같습니다. 미래를 먼저보고 세계를 이끌었던 천재에 부자라면 저렇게 살아야지요.

------------

http://fundersandfounders.com/how-bill-gates-started/


His father was a lawyer. A very successful one. His mother a teacher. Reading magazines in middle school he first thought about how cool it would be to open a company. You could say that’s how he started – with a childish dream. Many kids have dreams though, so what happened next?


How Bill Gates  Started To Hack

Next, Bill Gates saw a computer at 13. The school he went to bought one machine and a teletype. He paid for the time to use it. When money ran out, he hacked into the computer to use it for free. Then he got banned by the school. Then the school realized he had a rare skill so they asked him to use the computer and help them find bugs. He started to be a hacker.


Started to Hustle

Next, Bill scored 1590 out of 1600 on SAT. He went to Harvard. Only to find himself unsure about where to start – as a pre-law major or as something else? Reading Popular Mechanics one day in college he read an ad about a new computer. He called them to say that he wrote a programming language for it. (He hadn’t.) He asked if they might buy it. He hadn’t even started to write the language. But, he started to be a hustler. And, yes, the computer company was very interested in buying.


Being a Workaholic

Next Bill sat down with his friend Paul from high school, and the two wrote that programming language that he talked about on the phone. Bill wrote 50% of the code, using Harvard’s computers. Bill coded all day long, slept at the computer, woke up and picked up programming exactly where he left off. Bill started to be a workaholic.


Being a Copyright Guru

When they were done, Bill flew to New Mexico to show this new language he had written called BASIC. The computer company bought it for $3,000. But Bill kept the copyright. Did he somehow know it would be worth a lot in the future? So he started to be a copyright guru.


Started to Visualize the Future

Five years later IBM knocked on Bill’s door to see if he had written an operating system they could buy. Bill hadn’t. But he said, “Yes.” Real quick, he found an operating system from another person in Seattle and bought it. With the copyright. Then he sold it to IBM. For a lot more. This was DOS. And without copyright – they never asked for it. “Who would pay for software?” they reasoned. It’s the hardware that people are after. Bill saw the opportunity to make people pay for software. Bill started to see the future. He was now a visionary.


Bill Gates Started to Be a Perfectionist

Then Steve Jobs showed up. He wanted Bill to write new software that was visual. Programs like Excel and Words. Programs that looked human. Bill got down to work. Jobs thought Bill’s team’s product was tasteless, but Bill kept at it. He got better and better until he got really good. Bill started to be a perfectionist.


Being a Visual Thinker

But Bill was not going to spend his life working on Jobs’ brilliant ideas. Ideas, after all, are worthless until executed. Plus, Jobs’ ideas were stolen anyway. And so it was fair game to do the same. Bill remembered where he saw this idea of visual interfaces – it was Xerox. And now he wanted to create a visual operating system of his own. He called it Windows. He started to be a visual thinker.


Being a Tough Cookie

When Jobs heard about Windows, he went ballistic. He lashed out at Bill calling him down to Cupertino. In front of ten Apple employees Jobs accused Gates for robbing Apple. Bill listened calmly and replied that Jobs stole the idea just as he did himself. Bill started to be a tough cookie.

When Windows launched, Bill visualized a world where every home had a computer, and that computer was running Windows. Bill started to become very rich. And as his vision materialized, by 39 he became the richest man in the world.

------------

포브스 정보를 보면 2015/06/04 일자로. 여전히 세계 1위의 부자입니다.

http://www.forbes.com/profile/bill-gates/

Bill Gates

  • Bill Gates

  • Real Time Net Worth As of 6/5/15
  • $79.3 Billion
  • Cofounder, Bill & Melinda Gates Foundation
Age
59
Source Of Wealth
Microsoft, Self Made
Self-Made Score
8
Residence
Medina, WA
Citizenship
United States
Marital Status
Married
Children
3
Education
Drop Out, Harvard University


'IT이야기' 카테고리의 다른 글

The Tech Salary Guide 2014  (0) 2015.06.06
샤오미 웨어러블 혜성처럼 나타나 독주  (2) 2015.06.06
구글 포토 기가 막힙니다~  (0) 2015.06.05
Qualcomm news  (0) 2015.06.05
SW보안을 모르는 HW보안만 강조하는 회사  (0) 2015.06.05
Posted by 쁘레드
경제이야기/Stock2015. 5. 31. 06:12

Nuance = 뉴앙스, 누앙스, 뉘앙스


Apple의 Siri가 처음 나온것은 2011년 10월 Iphone 4S에서 부터였습니다.

Google Android의 경우 2010년 Goole I/O에서 voice recognition을 데모했었습니다. 2013년에 Google Now를 선보였고요.

2013년에 놀러갔다가 시리를 정말 잘쓰는 사람을 보고 앞으로 세상의 input은 keyboard가 아니라 voice라는 깨닮음을 얻고 Nuance를 살펴보다가 투자를 단행했습니다. 애플이랑 결별할지도 모른다는 rumor가 있었고, 주요 IT업체였던 Apple, Google, Microsoft 세 회사가 자체 voice recognition solution이 있었다는 것도 risk factor였는데 아이칸이 투자했다는 이야기에 좀더 서두르게 되서 한동한 손실에 시달렸어야 했지요. 물타기를 최저가 근처에서 많이해서 2015년 투자수익률을 NUAN가 주도하고 있습니다. 아직도 가치를 더 높게 보는 이유가


1. 매출과 순이익의 반이 Healthcare쪽에서 나오고 성장률이 상당히 높습니다.

2. IT쪽 매출과 발전이 상당히 느렸는데 smart automotive(자동차)쪽에 성장이 상당히 빠른것 같습니다. 1-2년 성장이 빠를것 같습니다. Wearable이 늘어날수록 voice 쪽 솔루션이 계속 필요합니다.

3. 라이센스 비용이 좀 비싸서 누군가 라이센스를 내는것보다 사는것이 낫다는 판단을 할 가능성이 높습니다. 헬스케어와 voice recognition solution 둘다 필요한 회사가 가장 적합하겠지요. 

4. 아직까지 돈을 못벌고 있는데 현금흐름도 좋아지고 이득도 늘고있어 주가가 폭등할 좋은 모멤텀이 쌓이고 있습니다.


Nuance의 4가지 분야는, 아래와 같고 전세계적으로 유명한 고객사를 가지고 있습니다.

Healthcare

Mobile & Consumer

Enterprise

Imaging

-------------------------


ValuationDividendFinancial ratiosMarginsProfileIncome statement
PriceEarnings
per share
P/E ratioPrice
sales ratio
Mkt CapEnterprise
value
DividendCurrent
ratio
Total debt
to assets
Net profit
margin
Operating
margin
EmployeesRevenueNet incomeEBITDA
NUAN16.87-0.382.785.29B6,899.1701.8137.92-2.975.5714,000475.06-14.189.52
MSFT46.862.4119.474.35379.08B315,789.500.312.9118.0422.9429.91128,00021,729.004,985.009,390.00
HPQ33.392.513.360.5960.69B67,397.4601.1320.773.975.62302,00025,453.001,011.002,977.00
CSCO29.311.7316.993.06149.07B115,662.400.212.9819.7820.0824.174,04212,137.002,437.003,516.00
XRX11.420.8613.320.712.59B19,699.770.071.4628.53.625.55145,6004,469.00162557
WSTC30.61.619.171.132.55B5,870.450.221.5297.878.619.579,700565.4948.63157.61
ADBE79.090.6131.078.8939.57B38,291.0802.2217.277.6515.612,4991,109.1884.89254.42
INTC34.462.3514.643.19163.48B162,593.200.481.7614.7715.5920.16106,70012,781.001,992.004,819.00
DELL05.9100.42150,032.200.621.1814.851.411.87108,800112,512.501,581.415,317.87
ORCL43.492.3918.25.08189.92B177,816.900.123.7231.6126.7536.27122,0009,327.002,495.004,144.00
IBM169.6815.7510.772.13167.09B197,231.101.11.334.6612.3315.32379,59219,590.002,416.004,044.00


-------------------------


KEY STATISTICS
Industry Range: Low Light Quintile Light Quintile Dark Quintile Light Quintile Light Quintile High Mouseover quintile for more detail
 

SHAREHOLDER EQUITY

Shares Outstanding313.8 M
Institutional Ownership79.28%
Number of Floating Shares309.2 M
Short Interest as % of Float4.52%

FINANCIAL STRENGTH (MRQ)

Quick Ratio-- 
Current Ratio1.81x
Debt/Equity0.89x
Debt/Assets0.38x
NUAN's debt to equity ratio indicates that it has been more aggressive with using debt to finance growth than 70% of its peers in the Software & Programming industry. The resultant effect on earnings would be more volatile than related companies.

VALUATION (MRQ)

Price/Earnings (TTM)-- 
Price/Sales (TTM)2.75x
Price/Book2.23x
Price/Cash Flow30.88x
NUAN was not profitable in its latest fiscal year, therefore the P/E Ratiois not applicable. Its Price to Cash Flow Ratio would give an alternative indication of its expense relative to the Software & Programming industry.

PROFITABILITY (TTM)

Gross Margin56.41%
Operating Margin0.30%
EBITDA Margin14.05%
Net Profit Margin-6.24%
NUAN's Gross Margin is comparable to other companies in the Software & Programming industry, which means it has relatively the same amount of cash to spend on business operations as its peers. As indicated by the Operating Margin, NUAN controls its costs and expenses better than 67% of its peers.

MANAGEMENT EFFECTIVENESS (TTM)

Return on Assets-2.06%
Return on Equity-4.81%
Return on Inves. Capital-2.35%
The Return on Equity for NUAN shows that it is able to reinvest its earnings as efficiently as its competitors in the Software & Programming industry. Typically, companies that have higher return on equity values are more attractive to investors.

GROWTH RATE (TTM)

Earnings Per Share26.9
Sales2.1
Dividend (MRQ)-- 
NUAN's EPS Growth Rate is greater than 61% of its peers in the Software & Programming industry.

DIVIDEND (TTM)

Dividend Yield-- 
Payout Ratio-- 
Annual Dividend0.00 
The average dividend yield for companies in the Software & Programming industry is 1.55%.

OPERATING RATIOS (TTM)

Asset Turnover0.33%
Inventory Turnover-- 
Receivables Turnover4.93%
Effective Tax Rate-- 
These ratios give an indicator of efficiency (ability to move inventory and generate sales) within a company, particularly ones with tangible goods (i.e. automotive, computer hardware) as compared to its peers.

COMPANY OFFICERS

ChairmanPaul A. Ricci
Executive Vice President - FinanceThomas L. Beaudoin
Corporate ExecutiveEarl H. Devanny
Executive Vice PresidentWilliam Robbins
Executive Vice PresidentAdam Bruce. Bowden
Lead DirectorRobert J. Frankenberg
DirectorRobert J. Finocchio
Independent DirectorBrett M. Icahn
Independent DirectorWilliam H. Janeway

COMPANY CONTACT

Employees14,000
Headquarters1 Wayside Rd
BURLINGTON, MA 01803-4609
Phone781-565-5000
Fax781-565-5001
Web Address
http://www.nuance.com
 

-------------------------

BALANCE SHEET
 5 yr Trend2010
09/30/10
2011
09/30/11
2012
09/30/12
2013
09/30/13
2014
09/30/14

ASSETS

Cash & Equivalents 5174471,130808547
Short Term Investments 53103941
Cash and Short Term Inv 5224781,130847588
Trade Accts Recvble, Gross 224287388397450
Prov. for Doubtful Accts (6)(6)(7)(14)(21)
Total Receivables, Net 225281381383428
Invent. - Finished Goods 25434
Inventories - Other 678129
Total Inventory 911111512
Prepaid Expenses 6277918880
Restricted Cash - Current 2570----
Deferred Income Tax --0887556
Other Current Assets ------20
Other Curr. Assets, Total 257887756
Total Current Assets 8428551,7011,4101,165
Buildings 2125273240
Land/Improvements 22222
Machinery/Equipment 125162224303370
Construction in Progress 13224
Prop./Plant/Equip. - Gross 149192255339417
Accumulated Depreciation (87)(113)(139)(178)(225)
Prop./Plant/Equip. - Net 6278116161191
Goodwill, Net 2,0782,3482,9553,2933,411
Intangibles, Gross 1,0591,2271,4841,5861,632
Accum. Intangible Amort. (373)(496)(577)(633)(716)
Intangibles, Net 686732907953915
Long Term Investments 28--------
Other Long Term Assets 7483120142138
Total Assets 3,7704,0955,7995,9595,820

LIABILITIES

Accounts Payable 79831139162
Accrued Expenses 147172211181210
Notes Payable/ST Debt 00000
Curr. Port. LT Dbt/Cap Ls. 873802465
Customer Advances 142186207254298
Income Taxes Payable 445----
Deferred Income Tax 0--------
Other Current Liabilities 224503468
Other Curr. Lblts, Total 149214261287366
Total Current Liabilities 382475965805642
Total Long Term Debt 8518531,7362,1082,127
Total Debt 8598602,1162,3542,132
Deferred Income Tax 6472161163156
Other Liabilities, Total 175202210244313
Total Liabilities 1,4731,6023,0713,3213,238

SHAREHOLDER EQUITY

Pref. Stock-Non Rdmbl, Net 555----
Common Stock 00000
Additional Paid-In Capital 2,5822,7462,9083,0173,153
Ret. Earn.(Accum. Deficit) (281)(243)(161)(369)(531)
Treasury Stock - Common (17)(17)(17)(17)(17)
Unrealized Gain (Loss) 000----
Cum. Trans. Adjustment 134(3)8(20)
Min. Pension Lblty Adj. (5)(2)(4)(1)(4)
Other Comprehensive Income 000----
Other Equity, Total 82(7)7(24)
Total Equity 2,2972,4932,7282,6382,582
Total Liabilities & Shareholders� Equity 3,7704,0955,7995,9595,820
Shr Outs.-Com. Primary Iss. 298309312316321
Shr Outs.-Com. Stk. Iss. 2 444----
Ttl Comm. Shares Outs. 302312316316321
Trsy. Shrs-Comm. Primary Iss. 44444
Trsy. Shrs-Comm. Iss. 2 000----

() = Negative Value
Values are displayed in Millions

-------------------------

INCOME STATEMENT
 5 yr Trend2010
09/30/10
2011
09/30/11
2012
09/30/12
2013
09/30/13
2014
09/30/14

REVENUE AND GROSS PROFIT

Total Revenue 1,1191,3191,6521,8551,923

OPERATING EXPENSES

Cost of Revenue, Total 409500605767844
Selling/Gen/Admin Expense 388454415495497
Sell/Gen/AdminExpenses,Tot 388454533600609
Research & Development 152179225289339
Depreciation/Amortization 888895105109
Purchased R&D Written-Off 0--------
Restructuring Charge 182381619
Other Unusual Expnse (In) 3122593024
Unusual Expense (Income) 4945674644
Total Operating Expense 1,0861,2661,5251,8071,945
Operating Income 335312648(21)

NON-OPERATING INCOME & EXPENSES

Inter Expse,Net Non-Operat (41)(37)(85)(138)(133)
Inter Income, Non-Operating 13222
Invest Income, Non-Operat ----6(4)(7)
Inter/Invest Inc, Non-Oper 138(3)(4)
OtherNon-OperatInc (Expnse) 61116(5)3
Other, Net 61116(5)3
Income Before Tax (1)3065(97)(155)

INCOME TAXES

Income Tax - Total 18(8)(142)19(5)
Income After Tax (19)38207(115)(150)

MINORITY INTEREST AND EQUITY IN AFFILIATES

Net Inc Before Extra Items (19)38207(115)(150)
Net Income (19)38207(115)(150)

ADJUSTMENTS TO NET INCOME

Total Adjust to Net Income 00(2)00
Income Available to Common Excl. Extra. Items (19)38205(115)(150)
Income Available to Common Incl. Extra. Items (19)38205(115)(150)

EPS RECONCILIATION

Basic/Primary Weighted Average Shares 287302306314317
Basic/Primary EPS Excl. Extra. Items (0.07)0.130.67(0.37)(0.47)
Basic/Primary EPS Incl. Extra. Items (0.07)0.130.67(0.37)(0.47)
Dilution Adjustment 00200
Diluted Weighted Average Shares 287316321314317
Diluted EPS Excl. Extra. Items (0.07)0.120.65(0.37)(0.47)
Diluted EPS Incl. Extra. Items (0.07)0.120.65(0.37)(0.47)

COMMON STOCK DIVIDENDS

Div/Share-ComStockPrimIssue 0.000.000.000.000.00
Gross Divid - Common Stock 00000

PRO FORMA INCOME

Pro Forma Net Income ----------

SUPPLEMENTAL ITEMS

Interest Expense, Suppl 413785138133
Depreciat/Amort, Suppl 2228324052

NORMALIZED INCOME

Total Special Items 4945674644
Normalized Income Before Tax 4775132(51)(111)
EffectSpecItemsInclTax(STEC) 1716231615
InclTaxExcl/ImpactSpecItems 357(118)3511
Normalized Income After Tax 1267251(85)(122)
Normalized Inc Avail to Common 1267248(85)(122)
Basic Normalized EPS 0.040.220.81(0.27)(0.38)
Diluted Normalized EPS 0.040.210.78(0.27)(0.38)

() = Negative Value
Values are displayed in Millions

-------------------------

CASH FLOW STATEMENT
 5 yr Trend2010
09/30/10
2011
09/30/11
2012
09/30/12
2013
09/30/13
2014
09/30/14

CASH FROM (USED BY) OPERATING ACTIVITIES

Net Income (19,099)38,238207,135(115,238)(150,343)
Depreciation/Depletion 157,156170,933187,183208,659221,776
Deferred Taxes 3,742(43,890)(151,547)(2,472)(22,172)
Unusual Items 6,83311,72500--
Other Non-Cash Items 114,670176,298200,368193,597221,957
Non-Cash Items 121,503188,023200,368193,597221,957
Cash Taxes Pd, Supplemental 14,21515,94913,29218,32915,591
Cash Interest Pd, Suppl 27,89923,03436,90795,72796,743
Accounts Receivable (773)(25,530)(55,210)25,165(39,502)
Prepaid Expenses (3,840)(11,793)13,88110,988(396)
Accounts Payable 4,710(8,193)22,645(26,843)(28,617)
Accrued Expenses (6,760)(6,775)8,93916,50613,617
Changes in Working Capital 32,9804,10729,860110,46486,929
Total Cash from Operations 296,282357,411472,999395,010358,147

PLUS: CASH FROM (USED BY) INVESTING ACTIVITIES

Purchase of Fixed Assets (25,974)(34,907)(62,910)(55,588)(60,287)
Purchase/Acq of Intangibles (15,300)(6,715)------
Capital Expenditures (41,274)(41,622)(62,910)(55,588)(60,287)
Acquisition of Business (203,729)(402,290)(884,945)(607,653)(253,000)
Sale/Maturity of Investment 011,65031,7898,76864,975
Purchase of Investments (48,499)(10,776)(15,156)(39,435)(62,639)
Other Investing Cash Flow (22,070)17,1846,74700
OtherInvestCashFlowItms,Tot (274,298)(384,232)(861,565)(638,320)(250,664)
Total Cash from Investing (315,572)(425,854)(924,475)(693,908)(310,951)

PLUS: CASH FROM (USED BY) FINANCING ACTIVITIES

Financing Cash Flow Items (13,650)(12,527)1,320,415560,837(45,407)
Sale/Issuance of Common 41,86036,66727,74730,21622,652
Repurch/Retirement Common 00(199,997)(184,388)(26,483)
Iss (Retirmnt) of Stock,Net 41,86036,667(172,250)(154,172)(3,831)
Short Term Debt Reduction (8,460)(7,535)(6,605)(425,634)--
Short Term Debt, Net (8,460)(7,535)(6,605)(425,634)--
Long Term Debt, Net (9,870)(10,643)(8,525)(1,688)(257,928)
Iss (Retirmnt) of Debt, Net (18,330)(18,178)(15,130)(427,322)(257,928)
Total Cash From Financing 9,8805,9621,133,035(20,657)(307,166)

EQUALS: INCREASE (DECREASE) IN CASH

Foreign Exchange Effects (998)(6,925)978(2,088)(918)
Net Change in Cash (10,408)(69,406)682,537(321,643)(260,888)
NetCash-BeginBal/RsvdforFutUse 527,038516,630447,2241,129,761808,118
NetCash-EndBal/RsrvforFutUse 516,630447,2241,129,761808,118547,230
Depreciation, Supplemental 157,156170,933187,183208,659221,776
Cash Interest Pd, Suppl 27,89923,03436,90795,72796,743
Cash Taxes Pd, Supplemental 14,21515,94913,29218,32915,591

() = Negative Value
Values are displayed in Thousands


'경제이야기 > Stock' 카테고리의 다른 글

20150529 아주 관심있는 종목 리스트  (0) 2015.05.31
Delta Airlines, DAL  (0) 2015.05.31
IRobot, IRBT  (0) 2015.05.31
숫자분석의 달인 quantifiedalpha.com  (0) 2015.05.13
19 stocks to buy now - CNNMoney  (0) 2015.03.28
Posted by 쁘레드

애플의 넘사벽은 어떤 누구도 당분간 근접할수 없을것 같습니다.

중국기업이 25위중에 5개나 있습니다.(20%) 100위중에는 15개가 있고요.(15%)


BrandZ TOP 100 MOST VALUABLE GLOBAL BRANDS 2015

  1. Apple, 애플

  2. Google, 구글

  3. Microsoft, 마이크로소프트

  4. IBM

  5. VISA, 비자카드

  6. AT&T

  7. Verizon, 버라이존

  8. Coca Cola, 코카콜라

  9. McDonald's, 맥도날드

  10. Marboro, 말보로

  11. Tencent, 텐센트

  12. Facebook, 페이스북

  13. Alibaba Group, 알리바바

  14. Amazon, 아마존

  15. China Mobile

  16. Wells Fargo

  17. GE

  18. UPS

  19. Disney, 디즈니

  20. Master Card, 마스터카드

  21. Baidu, 바이두

  22. ICBC

  23. Vodafone, 보다폰

  24. SAP

  25. American Express, 어메리칸 익스프레스

http://www.millwardbrown.com/mb-global/brand-strategy/brand-equity/brandz/top-global-brands/2015/key-results

전체 리스트는 여기서 확인 : http://www.millwardbrown.com/BrandZ/2015/Global/2015_BrandZ_Top100_Report.pdf


Top10 2006 vs 2015


---------------------------

BrandZ™ Global Top 10: 2006 and 2015

Rank 2006

Brand Value

2006 $M 2015

Brand Value

2015 $M

1 Microsoft 62,039 Apple 246,992

2 GE 55,834 Google 173,652

3 Coca-Cola 41,406 Microsoft 115,500

4 China Mobile 39,168 IBM 93,987

5 Marlboro 38,510 Visa 91,962

6 Walmart 37,567 AT&T 89,492

7 Google 37,445 Verizon 86,009

8 IBM 36,084 Coca-Cola 83,841

9 Citi 31,028 McDonald's 81,162

10 Toyota 30,201 Marlboro 80,352 

---------------------------

10년동안 성장률이 가장 높은 10개.

애플은 1위면서 10년동안 가장 높게 성장한 기업입니다. 앞으로 몇년도 계속 성장이 가능할것으로 보고 있습니다.

도미노 피자의 폭등이 부럽습니다. 파자따위로.

에르메스 명품 브랜드의 성장도 놀랍네요.

10-Year Top 10 Risers

Rank Brand Category

Brand value

% change

2015 vs 2006

1 Apple Technology 1,446%

2 AT&T Telecom Providers 1,240%

3 Amazon Retail 941%

4 Domino's Pizza Fast Food 900%

5 Skol Beer 702%

6 Verizon Telecom Providers 477%

7 Google Technology 364%

8 Zara Apparel 331%

9 SAP Technology 299%

10 Hermès Luxury 292%

---------------------------

---------------------------

---------------------------


Posted by 쁘레드
IT이야기2015. 5. 2. 02:59

MS가 CEO를 아주 잘 뽑았는지 기업을 상대로 돈을 벌고 소비자에게는 공짜로 푸는 작전이 잘 먹히고 있는것 같습니다. cloud쪽 실적도 대폭 성장하고 있고, 지난 10년간의 삽질후 이제 좀 정신을 차리는것 같습니다. Windows 10이 어떨지 궁금하네요.


아래글을 간단히 요약하면

- 3시간이나 되는 키노드

- Window/OSX/Linux 지원하는 Visual Studio Code발표

- 오피스 API공개

- 3년안에 Windows 10을 10억대에 깔겠다

- 중국시장에 대한 관심

- 가상현실 홀로렌즈


http://www.bloter.net/archives/227072


http://www.bloter.net/archives/227072


'IT이야기' 카테고리의 다른 글

Ubuntu 14.04와 한글  (3) 2015.05.04
LG의 짝퉁관리 실패 - BT 헤드셋 HBS-730  (0) 2015.05.02
아이폰6 짝퉁 삼성 갤럭시 S6  (7) 2015.05.02
스마트 로프, 줄넘기  (0) 2015.04.27
Qualcomm 퀄컴 실적  (0) 2015.04.26
Posted by 쁘레드
IT이야기2015. 4. 24. 22:28

MS가 반독점 조사를 받을때 windows 소스코드를 공개해고 했었는데, 결국 볼수만 있지 사용할수는 없는거지요? 공개도 모두에게 open한게 아니라 한정된 사람과 단체에게만 공개했었던것 같습니다. 저도 이 소스를 open source처럼 일반 사람들끼리 수정해서 만들어보면 어떨까 하는 생각을 했었는데 불가능 한거였네요.


github에 올려졌다니 누군가는 clone했을텐데, torrent에 찾아보면 있을듯.


Windows NT 4.0가 20년다되가지만 정말 잘 만들어진 운영체제인데, 이것을 기반으로 현재 필요한 wireless protocol(WIFI, BT etc), usb 2.0/3.0을 지원하면 꽤 쓸만할거라 생각됩니다.

-------------

Microsoft takes pirated windows NT 4.0 source code offline

Windows NT 4.0 may be nearly two decades old but that doesn't mean that Microsoft wants its sensitive source code out in public. After ignoring a copy of the partially leaked code for several years, the company recently asked GitHub to take an unauthorized copy offline, with success.

microsoft-pirate
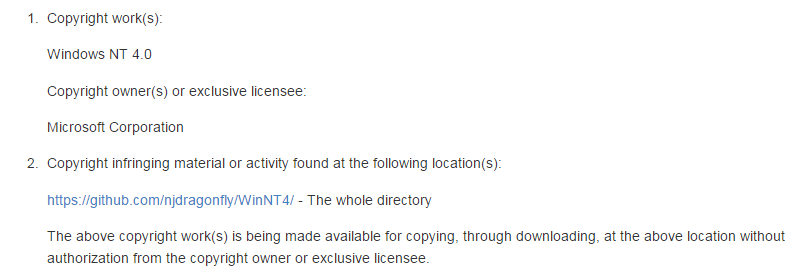
In February 2004 large portions of Microsoft’s Windows 2000 and Windows NT 4.0 source code leaked onto the Internet.

In a statement issued at the time, Microsoft said the breach didn’t come from inside. The company worked closely with the FBI to track down the source but these efforts were fruitless.

Hoping to keep the leak under control, Microsoft also started issuing takedown notices to sites and P2P file-sharers, urging them to stop offering the code.

However, like anything that leaks onto the Internet it’s pretty much impossible to remove something for good. Even today, several NT 4.0 copies are still floating around in the dark corners of the web.

Up until a few days ago there was even a copy hosted on the popular developer platform GitHub. Posted by “njdragonfly” the leaked source code has been available there since 2011.

Microsoft initially didn’t spot the infringing copy but it recently took action by sending GitHub a DMCA takedown notice.

Microsoft’s takedown notice

mstd

“We have received information that the domain listed above, which appears to be on servers under your control, is offering unlicensed copies of, or is engaged in other unauthorized activities relating to, copyrighted works published by Microsoft Corporation,” the company writes

The notice proved to be successful. A few hours after its arrival the repository wasmade inaccessible. Those who try to access it now are redirected to GitHub’s standard takedown page.

While it’s understandable that Microsoft doesn’t want its source code out in the open, it’s not as much as a security threat as it was a decade ago. Today, more than 10 years after it was first published, pretty much all exploits have been patched.

That said, it’s worth nothing that after all these years Microsoft is trying to contain the leak. But perhaps that’s just for sentimental value.

Windows NT 4.0

Windows_NT_4.0

Tagged in: 

http://torrentfreak.com/microsoft-takes-pirated-windows-nt-4-0-source-code-offline-150415/

'IT이야기' 카테고리의 다른 글

스마트 로프, 줄넘기  (0) 2015.04.27
Qualcomm 퀄컴 실적  (0) 2015.04.26
Amazon vs Microsoft on Cloud  (0) 2015.04.24
Twitch – 게이머를 위한 YouTube  (0) 2015.04.23
utorrent 지우자~  (0) 2015.04.21
Posted by 쁘레드
IT이야기2015. 4. 24. 21:57

MS가 클라우드에서 이렇게 빨리 성장하고 있었군요. 정말 무섭네요. 성장률로 보면 최고네요. 이번년내로 아마존을 재칠수도 있겠네요.

--------------------------

Comparing Microsoft and Amazon's cloud businesses

Amazon finally provided the first direct visibility over the finances associated with its AWS business today, and it provides an opportunity to compare them with one of the other two big enterprise cloud businesses which compete with it, Microsoft's. Microsoft doesn't explicitly report its cloud revenues, but "Commercial Cloud" is one of a number of revenue categories it provides enough detail around in its 10-Q to allow us to calculate it with some accuracy. Here, then, is a comparison of Amazon's AWS revenues and Microsoft's Commercial Cloud revenues over the same five quarters:

Screenshot 2015-04-23 18.09.34As you can see, the two are almost neck and neck at this point, with Microsoft's cloud revenues catching up to Amazon's over time. It seems likely that they will pass AWS revenues in the next couple of quarters. But the obvious problem with this chart is that they're not measuring the same thing: AWS is a discrete business, largely focused on public cloud services, whereas Microsoft's revenues reflect several quite different businesses that it's lumped together under this heading. However, this reflects something I wrote about last quarter, which is that Amazon would actually quite like to have a cloud business that looks more like Microsoft's:

It continues to be critical for both companies (and Google) to migrate their way up the cloud stack to the higher-layer services (as both I and Nadella called them), but Microsoft is already there, while Amazon continues to try to compete in a space I'm really not sure they can.

Where the two businesses overlap, Amazon's is certainly quite a bit larger, but Microsoft's cloud business looks a lot like the kind of business Amazon is trying to build, and quite rightly. The kind of business Amazon is in today is rapidly commoditizing, and its chances of moving up the stack are much slimmer than Microsoft's, which has a much longer history in this space and a massive legacy customer base to migrate over to it.

One other thing we don't know about Microsoft's cloud business is its profitability. It sits within the Commercial Other category at Microsoft, which reports gross margins of 41% last quarter, but those margins have been rising rapidly as Microsoft builds scale in this business. Amazon's operating margins on AWS, meanwhile, are far higher than in its core e-commerce business, but they appear to have fallen quite a bit year on year, likely reflecting that commoditization and the increasing competition in this space. I'm not sure Amazon will be able to turn those margins around in the near future unless it is able to execute that transition to higher-stack services and therefore better differentiate its offerings. Microsoft's trend currently looks healthier on both the revenue growth and margin side. And of course Microsoft has quite a few other more profitable segments to lean on while it builds this business, whereas Amazon continues to struggle to break even in its core business.


http://tumblr.jackdawresearch.com/post/117210588173/comparing-microsoft-and-amazons-cloud-businesses


'IT이야기' 카테고리의 다른 글

Qualcomm 퀄컴 실적  (0) 2015.04.26
MS Windows NT 4.0 source code  (0) 2015.04.24
Twitch – 게이머를 위한 YouTube  (0) 2015.04.23
utorrent 지우자~  (0) 2015.04.21
MP3 ID3 한글 깨지는것 - 복구는 불가능한듯  (0) 2015.04.21
Posted by 쁘레드