경제이야기/Stock2015. 5. 31. 08:43

[이전 날짜는 20150315 였습니다.]

그동안 아주 관심있는 종목이 변하진 않았네요. 다만 투자중인 Nuance가 좋은 성적을 내고 있어서 좋고, QCOM은 좋은 가격에 매각을 잘 해서 좋고요. Delta(DAL)는 손실구간으로 들어갔네요. 아마도 물타기 좀 해야할것 같고요. Ford가 어닝을 들으며 6개월간 이거 큰일인데 하는 마음이었는데 어떻게 할 좋은 방도가 생각이 안나네요. 계속 배당이라도 나와주니까 받아먹으며 버텨야지요.


----------------------

NameSymbolLast priceMkt capAvg vol52wk high52wk lowEPSP/EBeta
QUALCOMM, Inc.QCOM69.68113.55B10.92M81.9762.264.2216.511.19
Apple Inc.AAPL130.28750.55B52.53M134.5488.92868.0916.110.84
Delta Air Lines, Inc.DAL42.9435.05B12.10M51.0630.121.4130.360.79
Tesla Motors IncTSLA250.831.70B4.60M291.42181.4-3.17na0.63
Ford Motor CompanyF15.1860.33B24.02M18.1213.260.7819.451.53
Nuance Communications...NUAN16.875.29B2.61M19.6113.2-0.38na1.07
Goodyear Tire & Rubber...GT31.848.60B4.47M32.5118.879.893.222.16
Alcoa IncAA12.5115.29B19.21M17.7512.440.5223.891.62
Hanwha Q Cells Co Ltd...HQCL2.17216.26M467,282.002.840.92-1.11na2.54
eBay IncEBAY61.3674.54B7.04M61.6446.342.3825.740.85
Yahoo! Inc.YHOO42.9440.29B16.64M52.6232.93017.185.981.1
Alibaba Group Holding...BABA89.38223.05B20.44M12077.771.8249.19
Petroleo Brasileiro...PBR8.3652.81B42.39M20.944.9-1.13na1.88
Semicond. Manufacturing...SMI5.664.14B72,135.006.063.880.2423.341.3
Intel CorporationINTC34.46163.48B24.53M37.926.932.3514.640.95
NXP Semiconductors NVNXPI112.2528.26B3.12M112.8153.812.1751.682.65
Palo Alto Networks IncPANW169.5814.19B1.34M169.8472-1.88na
iRobot CorporationIRBT31.95949.69M394,162.004228.051.2325.91.82

--------------------


3/15일 대비 수익율인데, 어마어마한 상승을 보여주는 종목이 많네요. 그남아 뉴앙스라도 들고 있다는데에 의의를 둬야할듯. 가진 종목중에 마이너스도 있고요. 헐~

NameSymbolLast price
of 2015/05/29
Last price
of 2015/03/15
Change
QUALCOMM, Inc.QCOM69.6868.641.52
Apple Inc.AAPL130.28123.595.41
Delta Air Lines, Inc.DAL42.9445.5-5.63
Tesla Motors IncTSLA250.8188.6832.92
Ford Motor CompanyF15.1816.2-6.30
Nuance Communications...NUAN16.8713.8721.63
Goodyear Tire & Rubber...GT31.8425.2426.15
Alcoa IncAA12.5113.57-7.81
Hanwha Q Cells Co Ltd...HQCL2.171.1195.50
eBay IncEBAY61.3659.073.88
Yahoo! Inc.YHOO42.9442.870.16
Alibaba Group Holding...BABA89.3881.869.19
Petroleo Brasileiro...PBR8.365.0166.87
Semicond. Manufacturing...SMI5.664.331.63
Intel CorporationINTC34.4630.9311.41
NXP Semiconductors NVNXPI112.25104.677.24
Palo Alto Networks IncPANW169.58141.3419.98
iRobot CorporationIRBT31.9533.01-3.21


'경제이야기 > Stock' 카테고리의 다른 글

3 stocks to buy if the market crashes  (0) 2015.06.17
한화큐셀 HQCL ADR ratio change  (0) 2015.06.01
Delta Airlines, DAL  (0) 2015.05.31
Nuance, NUAN 추천  (0) 2015.05.31
IRobot, IRBT  (0) 2015.05.31
Posted by 쁘레드
경제이야기/Stock2015. 5. 13. 06:24

Seekingalpha에서 글을 보다가 GT(Goodyear tire)가 undervalue되었있다고 주장하는 글을 읽다가 상당히 재밌는 사이트를 알게됐습니다. 수치해석, 통계, 숫자표현 이런것에 능한사람이 만든것 같습니다. seekingalpha와 자매사이트 같기도 하고요. 다 맞다고 하는것은 아니고요, 계산 geeks들은 어떻게 계산하는지 같이 계산기 뚜드리는지 이해해 보고 싶습니다.


내용이 재밌어서 평소 관심있는 종목들을 넣어봤습니다.

https://quantifiedalpha.com/


---------------

GT(Goodyear TIre)

Market Cap: $7.55B (Mid Cap)
Market Beta: 2.23 (Very High Market Risk)
MetricGTPercentileAnalysis
10.25%98thStrongly Undervalued
4.50%91stStrong Growth
-5.29%14thBad Quality
1.78%67thSlightly Bullish
11.24%90thModerate Outperform

78
Days
$0.75$4.10B

-------------

AA(Alcoa)

Market Cap: $16.89B (Large Cap)
Market Beta: 1.64 (High Market Risk)
MetricAAPercentileAnalysis
4.21%78thModerately Undervalued
-0.61%35thWeak Growth
-1.98%28thMediocre Quality
-2.47%23rdModerately Bearish
-0.84%40thSlight Underperform

57
Days
$0.26$5.91B

-------------

DAL(Delta Airlines)

Market Cap: $35.84B (Large Cap)
Market Beta: 1.01 (Low Market Risk)
MetricDALPercentileAnalysis
1.43%59thSlightly Undervalued
-0.01%43rdWeak Growth
3.87%77thGreat Quality
0.02%45thSlightly Bearish
5.31%68thSlight Outperform

71
Days
$1.32$10.78B

-------------

NUAN(Nuance)

Market Cap: $4.99B (Mid Cap)
Market Beta: 1.11 (Average Market Risk)
MetricNUANPercentileAnalysis
-3.15%27thSlightly Overvalued
-1.96%21stNegative Growth
3.78%75thGood Quality
-4.37%12thModerately Bearish
-5.70%23rdModerate Underperform

-5
Days
$0.10$482.18M

-------------

QCOM(Qualcomm)

MetricQCOMPercentileAnalysis
-0.97%41stSlightly Overvalued
-0.50%36thWeak Growth
-3.13%22ndBad Quality
1.26%61stSlightly Bullish
-3.34%31stSlight Underperform
71
Days
$0.82$5.81B

--------------

AAPL(Apple)

Market Cap: $724.74B (Mega Cap)
Market Beta: 0.85 (Low Market Risk)
MetricAAPLPercentileAnalysis
-0.99%40thSlightly Overvalued
5.91%96thStrong Growth
5.11%89thGreat Quality
1.82%68thSlightly Bullish
11.85%92ndStrong Outperform

77
Days
$1.74$48.07B

-------------

F(Ford)

Market Cap: $61.74B (Large Cap)
Market Beta: 1.57 (High Market Risk)
MetricFPercentileAnalysis
7.69%93rdStrongly Undervalued
-0.23%40thWeak Growth
1.00%50thMediocre Quality
0.68%53rdSlightly Bullish
9.14%84thModerate Outperform

72
Days
$0.38$35.65B

-------------

NXP

Market Cap: $24.53B (Large Cap)
Market Beta: 2.65 (Very High Market Risk)
MetricNXPIPercentileAnalysis
-5.28%18thModerately Overvalued
6.37%97thStrong Growth
6.55%97thExcellent Quality
1.71%66thSlightly Bullish
9.35%85thModerate Outperform

71
Days
$1.24$1.51B


-------------

Top 50 ; 자체 지표로 value가 상당히 높다고 나온 상위 50개 종목인것 같습니다. 유료로 하면 screener같은것을 쓰게 해줄것 같습니다. 저는 Market Cap이 너무 작은 기업들은 valuation을 계산할 가치가 떨어진다고 생각합니다.


Rank Company Ticker Total Value Growth Quality Smart Earnings
  Alpha Alpha Alpha Alpha Alpha Strength
1 Net 1 Ueps Technologies Inc. UEPS 21.09% 8.41% 5.14% 3.83% 3.70%  
2 Bassett Furniture Industries Inc. BSET 20.63% 4.29% 7.06% 5.05% 4.23%  
3 Chipmos Technologies (BERMUDA) Ltd IMOS 20.00% 8.81% 0.80% 5.58% 4.81%  
4 Global Brass And Copper Holdings Inc BRSS 19.23% 6.66% 2.93% 3.82% 5.83%  
5 Shoe Carnival Inc. SCVL 18.27% 3.35% 3.28% 6.36% 5.28%  
6 Valero Energy Corp. VLO 17.86% 10.25% 2.15% 4.15% 1.30%  
7 Wal-Mart Stores Inc. WMT 17.79% 6.28% 1.54% 5.91% 4.06%  
8 Spartan Stores Inc. SPTN 17.17% 5.47% 5.80% 4.12% 1.79%  
9 Arch Capital Group Ltd ACGL 17.12% 6.86% 2.13% 1.39% 6.74%  
10 Voya Financial Inc VOYA 17.00% 10.84% 1.95% 1.39% 2.83%  
11 The Marcus Corporation MCS 16.79% 4.13% 2.19% 6.27% 4.20%  
12 United Continental Holdings, Inc. UAL 16.79% 6.52% 4.75% 4.62% 0.89%  
13 Lear Corp. LEA 16.67% 5.91% 4.49% 4.88% 1.39%  
14 Infinity Property and Casualty Corp. IPCC 16.59% 8.53% 1.51% 1.83% 4.71%  
15 Culp Inc. CFI 16.51% 1.89% 4.79% 7.00% 2.83%  
16 Sanmina-SCI Corp. SANM 16.46% 9.38% 1.18% 1.67% 4.23%  
17 Tsakos Energy Navigation Ltd TNP 16.17% 6.57% 5.63% -0.64% 4.61%  
18 ZAGG Incorporated ZAGG 16.10% 2.74% 5.59% 4.04% 3.73%  
19 Jabil Circuit Inc. JBL 16.02% 8.22% 3.11% 3.26% 1.43%  
20 Midwestone Financial Group Inc MOFG 15.94% 4.75% 1.14% 3.12% 6.93%  
21 Mainsource Financial Group Inc MSFG 15.92% 5.35% 1.62% 2.14% 6.80%  
22 Big 5 Sporting Goods Corp BGFV 15.92% 7.07% 1.39% 4.76% 2.70%  
23 Nova Measuring Instruments Ltd NVMI 15.69% 1.40% 1.97% 8.35% 3.96%  
24 SkyWest Inc. SKYW 15.54% 6.43% 3.02% 1.86% 4.23%  
25 Aetna Inc. AET 15.54% 4.61% 4.86% 2.98% 3.08%  
26 Delphi Automotive Plc DLPH 15.40% 1.26% 4.44% 6.37% 3.33%  
27 EchoStar Corp. SATS 15.28% 5.04% 1.75% 4.00% 4.48%  
28 Ducommun Inc DCO 15.20% 7.25% 3.28% 2.61% 2.06%  
29 Perfect World Co., Ltd. PWRD 15.12% 6.33% 0.09% 7.91% 0.79%  
30 Enlink Midstream Llc ENLC 15.06% 4.72% 0.57% 1.23% 8.54%  
31 AerCap Holdings N.V. AER 14.94% 5.22% 2.25% 4.62% 2.84%  
32 Consolidated Edison Inc. ED 14.84% 8.43% 0.81% 4.80% 0.80%  
33 AutoNation Inc. AN 14.67% 4.09% 2.62% 4.62% 3.34%  
34 Flextronics International Ltd. FLEX 14.49% 6.03% 4.37% 2.66% 1.42%  
35 Bravo Brio Restaurant Group, Inc. BBRG 14.31% 5.57% 0.86% 7.27% 0.61%  
36 Endurance Specialty Holdings Ltd ENH 14.20% 8.20% 1.94% -0.23% 4.29%  
37 Magna International Inc. MGA 14.10% 7.97% 2.28% 2.84% 1.01%  
38 Superior Energy Services, Inc. SPN 14.05% 7.84% 0.20% 5.17% 0.84%  
39 Huntington Ingalls Industries, Inc. HII 14.02% 1.84% 4.70% 3.90% 3.58%  
40 United Online, Inc. UNTD 14.01% 0.02% 4.08% 5.47% 4.43%  
41 Cai International Inc CAP 13.84% 9.49% 0.62% 1.29% 2.44%  
42 Encore Wire Corp. WIRE 13.83% 2.55% 0.38% 5.07% 5.83%  
43 Intel Corporation INTC 13.82% 3.09% 2.86% 7.41% 0.46%  
44 K12, Inc. LRN 13.78% 7.65% 0.88% 3.22% 2.03%  
45 Blount International Inc. BLT 13.77% 3.98% 1.83% 4.32% 3.64%  
46 Science Applications International Corporation SAIC 13.73% 4.10% 3.81% -2.62% 8.44%  
47 Federal Signal Corp. FSS 13.65% 5.00% 0.13% 4.56% 3.96%  
48 Targa Resources Corp. TRGP 13.61% 8.21% 0.44% 1.64% 3.32%  
49 Health Net, Inc. HNT 13.61% 3.36% 3.40% 5.85% 1.00%  
50 Central Garden & Pet Co. CENT 13.60% 5.36% 2.47% 2.69% 3.08%  


'경제이야기 > Stock' 카테고리의 다른 글

Nuance, NUAN 추천  (0) 2015.05.31
IRobot, IRBT  (0) 2015.05.31
19 stocks to buy now - CNNMoney  (0) 2015.03.28
Should You Consider Nuance Communications?  (0) 2015.03.24
2015년 유가상승 가능성을 이용한 투자 idea  (0) 2015.03.23
Posted by 쁘레드
경제이야기2015. 5. 1. 09:32

알루미늄 세상입니다. 

포드가 가장 많이 팔리는 F-150에 알루미늄 바디를 만들지를 않나,

애플이 알리미늄 유니바디로 제품을 내지를 않나,

라이카도 알루미늄 한 덩어리를 깍고 구멍뚫어 카메라 바디를 만들지요. 

여러 IT기기등에는 이미 알루미늄 또는 알루미늄 합금이 대세가 된것 같습니다. 가볍과 강하고 고급스러운 느낌까지. 참 좋은점이 많은 광물인것 같습니다.


자동차 바퀴, 차체, 

핸드폰 카메라 노트북 등 IT기기,

버드와이저 맥주병등 가정 용품까지.


가격이 많이 하락한것은 수요도 늘고있지만 공급이 더 많이 늘고있다고 판단됩니다. 수요는 계속 늘것으로보고 공급 과잉은 계속 수요를 못따라 갈것으로 보고 있습니다.


알루미늄하면 알코아(Alcoa)인데 가격이 많이 내려서 그런지 힘을 못쓰고 있네요. 재밌는것은 알코아 주가가 알루미늄 가격과 100% 싱크율을 보여주네요. 좋은 투자처라고 생각됩니다.


Got a while? Put your feet up and watch as the Leica T is lovingly polished, from start to finish. They do this with each and every camera, before hand-inking the milled-out lettering for labels.


美 알루미늄 프리미엄 1년來 최저
파운드당 24센트, 공급과잉에 하락세 전망

요즘 IT, 알루미늄 입는다

요즘 IT, 알루미늄 입는다
가볍고 튼튼한 알루미늄 소재로 만든 모바일 기기가 속속 선보이고 있다. 왼쪽 위부터 시계방향으로 아수스의 '젠북 UX305' 노트북PC, 독일 라이카의 디지털 카메라 '라이카T', 삼성전자의 스마트폰 '갤럭시 S6', 중국 화웨이의 스마트폰 'P8', 대만 HTC의 스마트폰 'm7'의 일체형 알루미늄 몸체.
 가볍고 튼튼한 알루미늄 소재로 만든 모바일 기기가 속속 선보이고 있다. 왼쪽 위부터 시계방향으로 아수스의 '젠북 UX305' 노트북PC, 독일 라이카의 디지털 카메라 '라이카T', 삼성전자의 스마트폰 '갤럭시 S6', 중국 화웨이의 스마트폰 'P8', 대만 HTC의 스마트폰 'm7'의 일체형 알루미늄 몸체. /자료: Getty Images 멀티비츠·각사


Posted by 쁘레드
경제이야기/Stock2015. 3. 21. 09:17

작년에 AA에서 쉽게 큰 수익을 봤었는데 요즘 속절없이 무너져서 아주 군침을 돌리며 바라보고 있습니다.

가장큰문제는 aluminum 가격이 고가대비 30%이상 급락한 영향이 큰것 같습니다.

To be updated

  • 알루미늄 가격이 떨어진 이유와 전망
  • AA의 Aluminum 매출/순이익 대비 비율
  • Fundamental analysis
  • 회사예상가치
  • 경쟁자
  • 최근 발표된 인수합병관련 영향
  • 내부자 거래동향


-------------------------------

Today’s Trading

Previous close12.96
Today’s open13.02
Day’s range12.90 - 13.09
Volume38,762,284
Average volume (3 months)21,945,226
Market cap$15.9B
Dividend yield0.93%
Data as of 4:00pm ET, 03/20/2015

Growth & Valuation

Earnings growth (last year)--
Earnings growth (this year)+20.88%
Earnings growth (next 5 years)+10.00%
Revenue growth (last year)+3.57%
P/E ratio57.1
Price/Sales0.77
Price/Book1.29

Competitors

 Today’s
change
Today’s
% change
AAPRBAlcoa Inc+0.13+0.30%
AAPRAlcoa Inc0.000.00%
Data as of 4:02pm ET, 03/20/2015

Financials

Next reporting dateApril 9, 2015
EPS forecast (this quarter)$0.25
Annual revenue (last year)$23.9B
Annual profit (last year)$268.0M
Net profit margin1.12%

Profile

Sector
Non-Energy Minerals
Industry
Aluminum
Chairman &
Chief Executive Officer
Klaus-Christian Kleinfeld
Chief Financial Officer &
Executive Vice President
William F. Oplinger
Corporate headquarters
New York, New York


Forecasts


-------------------------------

Data provided by Capital IQ, except where noted.

Valuation Measures 
Market Cap (intraday)5:15.85B
Enterprise Value (Mar 21, 2015)3:22.88B
Trailing P/E (ttm, intraday):61.76
Forward P/E (fye Dec 31, 2016)1:9.90
PEG Ratio (5 yr expected)1:1.05
Price/Sales (ttm):0.66
Price/Book (mrq):1.29
Enterprise Value/Revenue (ttm)3:0.96
Enterprise Value/EBITDA (ttm)6:6.64

Financial Highlights 
Fiscal Year
Fiscal Year Ends:Dec 31
Most Recent Quarter (mrq):Dec 31, 2014
Profitability
Profit Margin (ttm):1.12%
Operating Margin (ttm):9.53%
Management Effectiveness
Return on Assets (ttm):3.89%
Return on Equity (ttm):1.25%
Income Statement
Revenue (ttm):23.91B
Revenue Per Share (ttm):20.57
Qtrly Revenue Growth (yoy):14.20%
Gross Profit (ttm):4.77B
EBITDA (ttm)6:3.45B
Net Income Avl to Common (ttm):247.00M
Diluted EPS (ttm):0.21
Qtrly Earnings Growth (yoy):N/A
Balance Sheet
Total Cash (mrq):1.88B
Total Cash Per Share (mrq):1.54
Total Debt (mrq):8.85B
Total Debt/Equity (mrq):59.84
Current Ratio (mrq):1.49
Book Value Per Share (mrq):10.07
Cash Flow Statement
Operating Cash Flow (ttm):1.67B
Levered Free Cash Flow (ttm):369.12M

Trading Information 
Stock Price History
Beta:0.73
52-Week Change3:7.99%
S&P500 52-Week Change3:13.49%
52-Week High (Nov 21, 2014)3:17.75
52-Week Low (Mar 26, 2014)3:11.85
50-Day Moving Average3:14.96
200-Day Moving Average3:15.82

-------------------------------


Trefis Analysts estimate a price of $15.98 for Alcoa's stock, about 23% higher than the current market price. * Engineered Products constitute 38% of the Trefis price estimate for Alcoa's stock. * Primary Metals constitute 27% of the Trefis price estimate for Alcoa's stock. * Alumina constitutes 19% of the Trefis price estimate for Alcoa's stock


Analyst Research

More »

No Credit Suisse report available. 

  Thomson Reuters

Last Reported 3/20/15

  S&P Capital IQ

Last Reported 3/14/15

  SmartConsensus Report

Last Reported 03/20/2015


Technical Research 

  Market Edge Second Opinion

Last Reported 3/13/15

Technical Analysis »


Shareholder Equity

Shares Outstanding 

1.2 B 

Institutional Ownership 

63.47% 

Number of Floating Shares 

1.2 B 

Short Interest as % of Float 

2.50% 

Financial Strength (MRQ)

Quick Ratio 

0.94x 


Current Ratio 

1.49x 


Debt/Equity 

0.72x 


Debt/Assets 

0.24x 


AA's debt to equity ratio indicates that it has been more aggressive with using debt to finance growth than 63% of its peers in the Metal Mining industry. The resultant effect on earnings would be more volatile than related companies.

Valuation (MRQ)

Price/Earnings (TTM) 

63.75x 


Price/Sales (TTM) 

0.66x 


Price/Book 

1.29x 


Price/Cash Flow 

9.18x 


AA's P/E Ratio is greater than 91% of other companies in the Metal Mining industry. This typically means that investors are willing to pay more for its level of earnings relative to future growth.

Profitability (TTM)

Gross Margin 

19.99% 


Operating Margin 

4.30% 


EBITDA Margin 

14.93% 


Net Profit Margin 

0.74% 


AA's Gross Margin is comparable to other companies in the Metal Mining industry, which means it has relatively the same amount of cash to spend on business operations as its peers. As indicated by the Operating Margin, AA controls its costs and expenses better than 69% of its peers.

Management Effectiveness (TTM)

Return on Assets

0.48% 


Return on Equity 

2.17% 


Return on Inves. Capital 

0.63% 


The Return on Equity for AA shows that it is able to reinvest its earnings more efficiently than 75% of its competitors in the Metal Mining industry. Typically, companies that have higher return on equity values are more attractive to investors.

Growth Rate (TTM)

Earnings Per Share 

109.5 


Sales 

3.8 


Dividend (MRQ) 

0.0 


AA's EPS Growth Rate is greater than 92% of its peers in the Metal Mining industry.

Dividend (TTM)

Dividend Yield 

0.93% 


Payout Ratio 

56.68% 


Annual Dividend 

0.12 


AA's dividend yield is less than 94% of other companies in the Metal Mining industry. As indicated by the payout ratio, AA's earnings support the dividend payouts as well as others in the group.

Operating Ratios (TTM)

Asset Turnover 

0.65% 


Inventory Turnover 

6.61% 


Receivables Turnover 

18.29% 


Effective Tax Rate 

64.39% 


------------------------------------


Posted by 쁘레드
경제이야기/Stock2015. 3. 17. 05:42

AA stock price가 aluminum가격과 100% 싱크를 보여왔지만, 이제는 아니다는 내용인듯. 이미 AA의 매출 기여도에 AA는 50%밖에 안되는데. 다음에 다시 정리.


------------------------

Summary

  • For the last 5+ years, shares of Alcoa have, for the most part, tracked the LME aluminum spot price.
  • A change in internal investment strategy could be freeing the company from the clutches of the commodity.
  • After three acquisitions, Alcoa can produce almost every part required in a metallic airplane.
  • The recent acquisitions have also beefed up Alcoa's exposure to titanium at a crucial time.

For as long as I have been trading stocks, there has been one thing drilled into my head over and over again when it comes to companies in the commodity business: their stock almost always trades with the commodity itself. Whether it be gold, copper, natural gas, oil, or any other commodity, this rule always holds true. Don't believe me? Just check any oil stock's performance since the price of the liquid began its decent in late November.

The thought behind this principle is so simple that even the most inexperienced of investors should be able to understand. When companies produce a commodity and the price of that commodity is high, revenue is equally high, margins expand and earnings rise. On the other hand, when the value of the underlying commodity falls, revenue dips, but costs remain the same. Therefore, margins contract (maybe even turn negative) and earnings decline sharply. In each case, the stock trades accordingly, as can be seen in the 5-year chart of the aluminum producer, Alcoa (NYSE:AA), presented below.
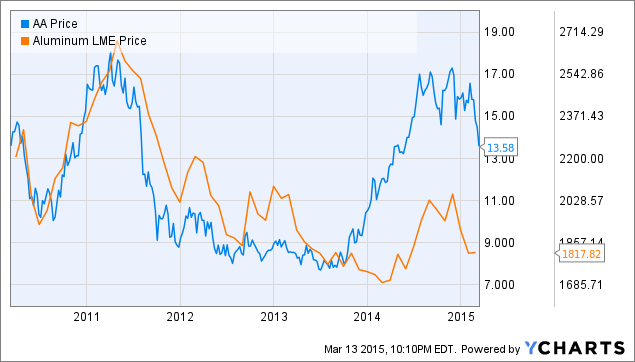
AA Chart

AA data by YCharts

So, what can a company do to break this lockstep correlation from occurring? The company must fundamentally change its business. And that is exactly what Alcoa has been doing ever since Klaus Kleinfeld took the helm in 2008, divesting high cost production capacity and investing in new value-adding technologies through both internal development and external acquisitions.

When Kleinfeld took over, Alcoa was coming off one of the strongest years of financial performance in memory. Revenue reached a record $30.7 billion and EPS was reported at $2.95. Now, just as Alcoa appears to be returning to form, recently reporting what were undoubtedly the strongest yearly financial results at the company since 2007/2008 that generated earnings of $.92 per share on $23.9 billion in revenue, some are beginning to call a top. Some of the bearish theses include an oversupply of aluminum or a slowdown in aluminum demand. Both of which are health concerns. However, investors must realize that this Alcoa is not the company that saw its shares decline some 80 plus percent in 2008.

For starters, the old Alcoa was investing heavily in expanding the company's production capacity. Read the following excerpts from the 2007 annual report:

We invested in new plants, expanded production at others, modernized operations, renegotiated long-term power agreements, and built new energy facilities to extend our energy access at competitive rates, while also continuing to invest in growth markets such as Brazil, China, and Russia.

In total, our capital investments were approximately $3.16 billion in 2007 (excluding currency impacts) with nearly 60 percent, or $1.7 billion, dedicated to growth projects.

The "growth projects" talked about referenced the construction of two smelters in Iceland and Norway, while much of the rest of the capital budget was spent on various energy producing projects and other, smaller capacity building initiatives. Each of these investments caused the company to become more levered to commodity pricing. Thus, when the LME price sank in 2008, you better believe the stock followed.

By contrast, the new Alcoa has targeted its investing activities on the downstream, value-added side of the business, while divesting high cost capacity to lower its positions on both the alumina and aluminum cost curves.

Above is a graphical representation of Alcoa's positioning on the aluminumcost curve. As you can see, the company has successfully reduced its positioning by 8% points over the last four years through the closing of high cost capacity, something that was not occurring at the peak in 2008. The same holds true for the company's position on the alumina cost curve shown below.

The change here has been a bit more modest, declining only 5% pts over the four-year span. However, in both cases, Alcoa is improving its positioning, thus protecting itself from the volatile swings that can be seen in the commodity market by shutting down high cost capacity. Since the peak in 2007, the company has closed, curtailed, or sold roughly 31% of its highest cost smelting capacity. And Alcoa appears poised to expand upon these efforts in 2015, announcing the review of 500 metric tons (14%) of smelting capacity and 2.8 million metric tons (16%) of refining capacity for curtailment or divestiture.

Moving to the perhaps more exciting side of the portfolio transformation, Alcoa has begun to differentiate its products for more sustainable end markets such as aerospace and automotive. In aerospace, the strides made have been phenomenal, adding Firth Rixon, Tital, and RTI International to its portfolio in the past 6 months or so. Each of which, has allowed Alcoa to expand its presence in the aircraft. Just look at the graphic below.

Alcoa now has the ability to produce nearly every part of the metallic-intensive aircrafts assembled and sold by the likes of Boeing (NYSE:BA) and Airbus. These differentiated products are much less likely to be exposed to the same commodity-based pricing scrutiny as the basic aluminum or alumina that was being produced back in 2007.

The acquisitions of these three companies also makes Alcoa one of, if not, the top producers of titanium domestically. This shift could not have come at a better time, as Russian sanctions are currently threatening the titanium imports that U.S. industries, as well as the defense sector, so heavily rely on.

Final Thoughts

Summing it all up, Klaus Kleinfeld is truly transforming Alcoa as we know it, attempting to break both the company and the stock free from their cyclical ties to the commodity price of aluminum. And, I believe he is doing an excellent job of it, targeting the company's investment spending on value-enhancing, downstream initiatives instead of on the expansion of high cost capacity that was seen in 2007. Though the prices paid for these acquisitions do include a fairly sizeable premium, the investments are justified from my standpoint and the stock should come to reflect that soon enough.


Posted by 쁘레드
경제이야기/Stock2015. 3. 16. 09:47

년초에 1년목표 수익률을 다 달성해 놓는것이 어깨에 힘빼고 치기에 좋은데, 이번년은 벌써 3월인데 녹녹치 않네요.

NXP Semiconductors는 작년말에 들어갔어야 했는데, 다른데 정신이 팔려있어서 좋은 보석을 놓쳤네요. 추가 상승여지가 얼마나 있는지 잘 생각해봐야 하겠네요.


NameSymbolLast priceMkt capVolumeAvg vol52wk high52wk lowEPSP/EBetaEBITDA Cur Ratio
QUALCOMM, Inc.QCOM68.64113.23B13.95M13.65M81.9762.264.7314.511.229.38B3.55
Apple Inc.AAPL123.59719.88B51.83M59.79M133.673.04717.4216.650.8767.66B1.13
Intel CorporationINTC30.93146.48B47.95M30.43M37.924.42.3213.320.9524.19B1.73
Delta Air Lines, Inc.DAL45.537.50B10.04M12.42M51.0630.120.7659.80.826.91B0.74
Tesla Motors IncTSLA188.6823.73B5.43M5.49M291.42177.22-2.35n/a0.645.24M1.48
Ford Motor CompanyF16.264.09B27.88M27.14M18.1213.260.7920.441.5311.21B1.74
Nuance Communications...NUAN13.874.51B1.50M2.18M19.6113.2-0.46n/a1.14186.74M1.92
Goodyear Tire & Rubber...GT25.246.80B2.33M3.52M28.9818.878.842.852.092.25B1.63
Alcoa IncAA13.5716.59B16.91M22.39M17.7511.610.266.751.583.561.48
eBay IncEBAY59.0771.48B7.87M8.06M60.9346.340.051,144.550.915.04B1.51
Yahoo! Inc.YHOO42.8740.13B9.09M14.61M52.6232.157.455.751.11682.48M2.14
Alibaba Group Holding...BABA81.86203.61B12.66M15.84M12080.031.845.494.74B2.7
Semicond. Manufacturing...SMI4.33.09B31,041.0073,249.005.483.740.1922.111.43671.27M1.58
NXP Semiconductors NVNXPI104.6726.35B8.27M4.05M105.1253.812.1748.192.751.47B2
Palo Alto Networks IncPANW141.3411.63B958,853.001.48M149.349957.4712-3.28n/a-76.94M2.08
iRobot CorporationIRBT33.01979.48M623,229.00583,000.0045.0928.051.2526.361.7465.37M3.79
Petroleo Brasileiro...PBR5.0133.48B56.84M45.56M20.944.90.935.381.8822.17B1.7
Hanwha Q Cells Co LtdHQCL1.11110.50M556,940.00352,504.003.970.92-1.24n/a2.8759.40M1.85


'경제이야기 > Stock' 카테고리의 다른 글

AA This Is Not The Same Alcoa  (0) 2015.03.17
F Ford Motor Could Be Worth Up To $37 Per Share  (0) 2015.03.17
Kiplinger's 2015 Feb - Future stock 추천  (0) 2015.03.15
유럽동향 2015/03/12  (0) 2015.03.13
20150308 BioTech 추천주  (0) 2015.03.09
Posted by 쁘레드
경제이야기2015. 3. 3. 08:15


Today’s Trading

Previous close14.79
Today’s open14.84
Day’s range14.74 - 15.02
Volume19,332,641
Average volume (3 months)19,283,481
Market cap$18.1B
Dividend yield0.80%
Data as of 4:00pm ET, 03/02/2015

Growth & Valuation

Earnings growth (last year)--
Earnings growth (this year)+26.25%
Earnings growth (next 5 years)+10.00%
Revenue growth (last year)+3.57%
P/E ratio65.8
Price/Sales0.77
Price/Book1.47

Competitors

 Today’s
change
Today’s
% change
SIALSigma-Aldrich Corp+0.01+0.01%
ASHAshland Inc+2.98+2.34%
HUNHuntsman Corp+0.08+0.36%
MTXMinerals Technologie...+1.51+2.06%
Data as of 4:04pm ET, 03/02/2015

Financials

Next reporting dateApril 9, 2015
EPS forecast (this quarter)$0.26
Annual revenue (last year)$23.9B
Annual profit (last year)$268.0M
Net profit margin1.12%

Profile

Sector
Non-Energy Minerals
Industry
Aluminum
Chairman &
Chief Executive Officer
Klaus-Christian Kleinfeld
Chief Financial Officer &
Executive Vice President
William F. Oplinger
Corporate headquarters
New York, New York

Forecasts


'경제이야기' 카테고리의 다른 글

Bank of America(BOA, BAC) Mortgage settlement - WSJ  (0) 2015.03.04
Bank of America(BOA, BAC) Mortgage settlement  (0) 2015.03.04
NUAN 2015/03/02  (0) 2015.03.03
Ford F 2015/03/02  (0) 2015.03.03
DAL 2015/03/02  (0) 2015.03.03
Posted by 쁘레드