Seekingalpha에서 글을 보다가 GT(Goodyear tire)가 undervalue되었있다고 주장하는 글을 읽다가 상당히 재밌는 사이트를 알게됐습니다. 수치해석, 통계, 숫자표현 이런것에 능한사람이 만든것 같습니다. seekingalpha와 자매사이트 같기도 하고요. 다 맞다고 하는것은 아니고요, 계산 geeks들은 어떻게 계산하는지 같이 계산기 뚜드리는지 이해해 보고 싶습니다.
내용이 재밌어서 평소 관심있는 종목들을 넣어봤습니다.
https://quantifiedalpha.com/

---------------
Market Cap: $7.55B (Mid Cap)
Market Beta: 2.23 (Very High Market Risk)
| Metric | GT | Percentile | Analysis |
| Value Alpha: | 10.25% | 98th | Strongly Undervalued |
| Growth Alpha: | 4.50% | 91st | Strong Growth |
| Quality Alpha: | -5.29% | 14th | Bad Quality |
| Smart Alpha: | 1.78% | 67th | Slightly Bullish |
| Total Alpha: | 11.24% | 90th | Moderate Outperform |
| Days to Earnings Release | 78 Days | Earnings Strength Rating | |
| Wall St. Consensus EPS Estimate | $0.75 | Wall St. Consensus Rev. Estimate | $4.10B |
-------------
Market Cap: $16.89B (Large Cap)
Market Beta: 1.64 (High Market Risk)
| Metric | AA | Percentile | Analysis |
| Value Alpha: | 4.21% | 78th | Moderately Undervalued |
| Growth Alpha: | -0.61% | 35th | Weak Growth |
| Quality Alpha: | -1.98% | 28th | Mediocre Quality |
| Smart Alpha: | -2.47% | 23rd | Moderately Bearish |
| Total Alpha: | -0.84% | 40th | Slight Underperform |
| Days to Earnings Release | 57 Days | Earnings Strength Rating | |
| Wall St. Consensus EPS Estimate | $0.26 | Wall St. Consensus Rev. Estimate | $5.91B |
-------------
Market Cap: $35.84B (Large Cap)
Market Beta: 1.01 (Low Market Risk)
| Metric | DAL | Percentile | Analysis |
| Value Alpha: | 1.43% | 59th | Slightly Undervalued |
| Growth Alpha: | -0.01% | 43rd | Weak Growth |
| Quality Alpha: | 3.87% | 77th | Great Quality |
| Smart Alpha: | 0.02% | 45th | Slightly Bearish |
| Total Alpha: | 5.31% | 68th | Slight Outperform |
| Days to Earnings Release | 71 Days | Earnings Strength Rating | |
| Wall St. Consensus EPS Estimate | $1.32 | Wall St. Consensus Rev. Estimate | $10.78B |
-------------
Market Cap: $4.99B (Mid Cap)
Market Beta: 1.11 (Average Market Risk)
| Metric | NUAN | Percentile | Analysis |
| Value Alpha: | -3.15% | 27th | Slightly Overvalued |
| Growth Alpha: | -1.96% | 21st | Negative Growth |
| Quality Alpha: | 3.78% | 75th | Good Quality |
| Smart Alpha: | -4.37% | 12th | Moderately Bearish |
| Total Alpha: | -5.70% | 23rd | Moderate Underperform |
| Days to Earnings Release | -5 Days | Earnings Strength Rating | |
| Wall St. Consensus EPS Estimate | $0.10 | Wall St. Consensus Rev. Estimate | $482.18M |
-------------
| Metric | QCOM | Percentile | Analysis |
| Value Alpha: | -0.97% | 41st | Slightly Overvalued |
| Growth Alpha: | -0.50% | 36th | Weak Growth |
| Quality Alpha: | -3.13% | 22nd | Bad Quality |
| Smart Alpha: | 1.26% | 61st | Slightly Bullish |
| Total Alpha: | -3.34% | 31st | Slight Underperform |
| Days to Earnings Release | 71 Days | Earnings Strength Rating | |
| Wall St. Consensus EPS Estimate | $0.82 | Wall St. Consensus Rev. Estimate | $5.81B |
--------------
Market Cap: $724.74B (Mega Cap)
Market Beta: 0.85 (Low Market Risk)
| Metric | AAPL | Percentile | Analysis |
| Value Alpha: | -0.99% | 40th | Slightly Overvalued |
| Growth Alpha: | 5.91% | 96th | Strong Growth |
| Quality Alpha: | 5.11% | 89th | Great Quality |
| Smart Alpha: | 1.82% | 68th | Slightly Bullish |
| Total Alpha: | 11.85% | 92nd | Strong Outperform |
| Days to Earnings Release | 77 Days | Earnings Strength Rating | |
| Wall St. Consensus EPS Estimate | $1.74 | Wall St. Consensus Rev. Estimate | $48.07B |
-------------
Market Cap: $61.74B (Large Cap)
Market Beta: 1.57 (High Market Risk)
| Metric | F | Percentile | Analysis |
| Value Alpha: | 7.69% | 93rd | Strongly Undervalued |
| Growth Alpha: | -0.23% | 40th | Weak Growth |
| Quality Alpha: | 1.00% | 50th | Mediocre Quality |
| Smart Alpha: | 0.68% | 53rd | Slightly Bullish |
| Total Alpha: | 9.14% | 84th | Moderate Outperform |
| Days to Earnings Release | 72 Days | Earnings Strength Rating | |
| Wall St. Consensus EPS Estimate | $0.38 | Wall St. Consensus Rev. Estimate | $35.65B |
-------------
NXP
Market Cap: $24.53B (Large Cap)
Market Beta: 2.65 (Very High Market Risk)
| Metric | NXPI | Percentile | Analysis |
| Value Alpha: | -5.28% | 18th | Moderately Overvalued |
| Growth Alpha: | 6.37% | 97th | Strong Growth |
| Quality Alpha: | 6.55% | 97th | Excellent Quality |
| Smart Alpha: | 1.71% | 66th | Slightly Bullish |
| Total Alpha: | 9.35% | 85th | Moderate Outperform |
| Days to Earnings Release | 71 Days | Earnings Strength Rating | |
| Wall St. Consensus EPS Estimate | $1.24 | Wall St. Consensus Rev. Estimate | $1.51B |
-------------
Top 50 ; 자체 지표로 value가 상당히 높다고 나온 상위 50개 종목인것 같습니다. 유료로 하면 screener같은것을 쓰게 해줄것 같습니다. 저는 Market Cap이 너무 작은 기업들은 valuation을 계산할 가치가 떨어진다고 생각합니다.
| Rank | Company | Ticker | Total | Value | Growth | Quality | Smart | Earnings |
| Alpha | Alpha | Alpha | Alpha | Alpha | Strength | |||
| 1 | Net 1 Ueps Technologies Inc. | UEPS | 21.09% | 8.41% | 5.14% | 3.83% | 3.70% | |
| 2 | Bassett Furniture Industries Inc. | BSET | 20.63% | 4.29% | 7.06% | 5.05% | 4.23% | |
| 3 | Chipmos Technologies (BERMUDA) Ltd | IMOS | 20.00% | 8.81% | 0.80% | 5.58% | 4.81% | |
| 4 | Global Brass And Copper Holdings Inc | BRSS | 19.23% | 6.66% | 2.93% | 3.82% | 5.83% | |
| 5 | Shoe Carnival Inc. | SCVL | 18.27% | 3.35% | 3.28% | 6.36% | 5.28% | |
| 6 | Valero Energy Corp. | VLO | 17.86% | 10.25% | 2.15% | 4.15% | 1.30% | |
| 7 | Wal-Mart Stores Inc. | WMT | 17.79% | 6.28% | 1.54% | 5.91% | 4.06% | |
| 8 | Spartan Stores Inc. | SPTN | 17.17% | 5.47% | 5.80% | 4.12% | 1.79% | |
| 9 | Arch Capital Group Ltd | ACGL | 17.12% | 6.86% | 2.13% | 1.39% | 6.74% | |
| 10 | Voya Financial Inc | VOYA | 17.00% | 10.84% | 1.95% | 1.39% | 2.83% | |
| 11 | The Marcus Corporation | MCS | 16.79% | 4.13% | 2.19% | 6.27% | 4.20% | |
| 12 | United Continental Holdings, Inc. | UAL | 16.79% | 6.52% | 4.75% | 4.62% | 0.89% | |
| 13 | Lear Corp. | LEA | 16.67% | 5.91% | 4.49% | 4.88% | 1.39% | |
| 14 | Infinity Property and Casualty Corp. | IPCC | 16.59% | 8.53% | 1.51% | 1.83% | 4.71% | |
| 15 | Culp Inc. | CFI | 16.51% | 1.89% | 4.79% | 7.00% | 2.83% | |
| 16 | Sanmina-SCI Corp. | SANM | 16.46% | 9.38% | 1.18% | 1.67% | 4.23% | |
| 17 | Tsakos Energy Navigation Ltd | TNP | 16.17% | 6.57% | 5.63% | -0.64% | 4.61% | |
| 18 | ZAGG Incorporated | ZAGG | 16.10% | 2.74% | 5.59% | 4.04% | 3.73% | |
| 19 | Jabil Circuit Inc. | JBL | 16.02% | 8.22% | 3.11% | 3.26% | 1.43% | |
| 20 | Midwestone Financial Group Inc | MOFG | 15.94% | 4.75% | 1.14% | 3.12% | 6.93% | |
| 21 | Mainsource Financial Group Inc | MSFG | 15.92% | 5.35% | 1.62% | 2.14% | 6.80% | |
| 22 | Big 5 Sporting Goods Corp | BGFV | 15.92% | 7.07% | 1.39% | 4.76% | 2.70% | |
| 23 | Nova Measuring Instruments Ltd | NVMI | 15.69% | 1.40% | 1.97% | 8.35% | 3.96% | |
| 24 | SkyWest Inc. | SKYW | 15.54% | 6.43% | 3.02% | 1.86% | 4.23% | |
| 25 | Aetna Inc. | AET | 15.54% | 4.61% | 4.86% | 2.98% | 3.08% | |
| 26 | Delphi Automotive Plc | DLPH | 15.40% | 1.26% | 4.44% | 6.37% | 3.33% | |
| 27 | EchoStar Corp. | SATS | 15.28% | 5.04% | 1.75% | 4.00% | 4.48% | |
| 28 | Ducommun Inc | DCO | 15.20% | 7.25% | 3.28% | 2.61% | 2.06% | |
| 29 | Perfect World Co., Ltd. | PWRD | 15.12% | 6.33% | 0.09% | 7.91% | 0.79% | |
| 30 | Enlink Midstream Llc | ENLC | 15.06% | 4.72% | 0.57% | 1.23% | 8.54% | |
| 31 | AerCap Holdings N.V. | AER | 14.94% | 5.22% | 2.25% | 4.62% | 2.84% | |
| 32 | Consolidated Edison Inc. | ED | 14.84% | 8.43% | 0.81% | 4.80% | 0.80% | |
| 33 | AutoNation Inc. | AN | 14.67% | 4.09% | 2.62% | 4.62% | 3.34% | |
| 34 | Flextronics International Ltd. | FLEX | 14.49% | 6.03% | 4.37% | 2.66% | 1.42% | |
| 35 | Bravo Brio Restaurant Group, Inc. | BBRG | 14.31% | 5.57% | 0.86% | 7.27% | 0.61% | |
| 36 | Endurance Specialty Holdings Ltd | ENH | 14.20% | 8.20% | 1.94% | -0.23% | 4.29% | |
| 37 | Magna International Inc. | MGA | 14.10% | 7.97% | 2.28% | 2.84% | 1.01% | |
| 38 | Superior Energy Services, Inc. | SPN | 14.05% | 7.84% | 0.20% | 5.17% | 0.84% | |
| 39 | Huntington Ingalls Industries, Inc. | HII | 14.02% | 1.84% | 4.70% | 3.90% | 3.58% | |
| 40 | United Online, Inc. | UNTD | 14.01% | 0.02% | 4.08% | 5.47% | 4.43% | |
| 41 | Cai International Inc | CAP | 13.84% | 9.49% | 0.62% | 1.29% | 2.44% | |
| 42 | Encore Wire Corp. | WIRE | 13.83% | 2.55% | 0.38% | 5.07% | 5.83% | |
| 43 | Intel Corporation | INTC | 13.82% | 3.09% | 2.86% | 7.41% | 0.46% | |
| 44 | K12, Inc. | LRN | 13.78% | 7.65% | 0.88% | 3.22% | 2.03% | |
| 45 | Blount International Inc. | BLT | 13.77% | 3.98% | 1.83% | 4.32% | 3.64% | |
| 46 | Science Applications International Corporation | SAIC | 13.73% | 4.10% | 3.81% | -2.62% | 8.44% | |
| 47 | Federal Signal Corp. | FSS | 13.65% | 5.00% | 0.13% | 4.56% | 3.96% | |
| 48 | Targa Resources Corp. | TRGP | 13.61% | 8.21% | 0.44% | 1.64% | 3.32% | |
| 49 | Health Net, Inc. | HNT | 13.61% | 3.36% | 3.40% | 5.85% | 1.00% | |
| 50 | Central Garden & Pet Co. | CENT | 13.60% | 5.36% | 2.47% | 2.69% | 3.08% |
'경제이야기 > Stock' 카테고리의 다른 글
| Nuance, NUAN 추천 (0) | 2015.05.31 |
|---|---|
| IRobot, IRBT (0) | 2015.05.31 |
| 19 stocks to buy now - CNNMoney (0) | 2015.03.28 |
| Should You Consider Nuance Communications? (0) | 2015.03.24 |
| 2015년 유가상승 가능성을 이용한 투자 idea (0) | 2015.03.23 |


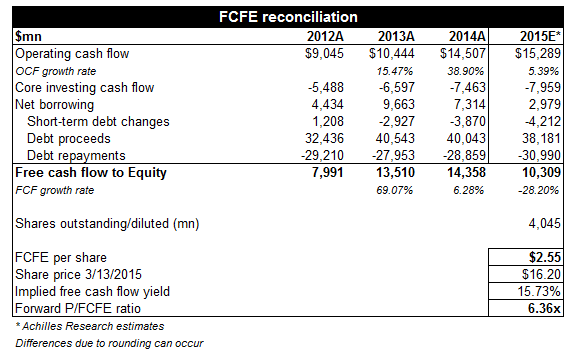 Source: Achilles Research, Company Financials
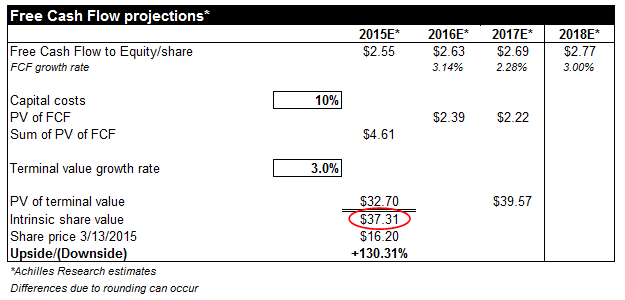 Source: Achilles Research, Company Financials

